Figure 5.
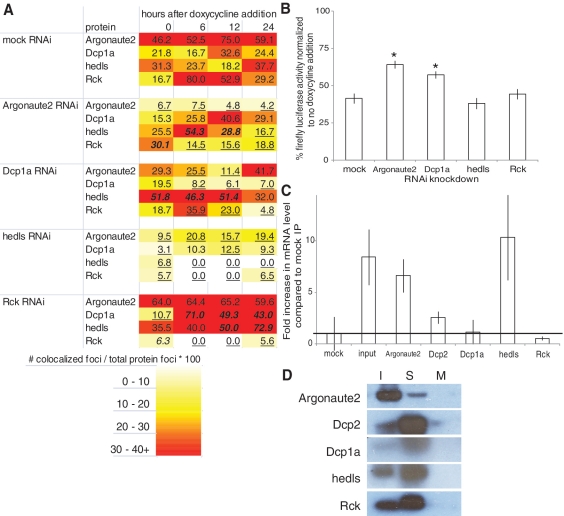
RNAi and RNA immunoprecipitation studies of Group A proteins. (A) Heat map of Group A protein interaction with miRNA-regulated mRNA after siRNA transfection. Number of co-localized foci is divided by number of total protein foci to normalize for variable protein levels and get percentage of protein interacting with the target mRNA. Each data point is an aggregate of five images with ∼20 cells total. A statistical analysis was conducted comparing differences between population proportions of the mock RNAi control to each RNAi knockdown. Bold/italicized numbers indicate results significantly greater than the mock RNAi control and underlined numbers indicate results significantly less than the mock RNAi control (P < 0.05). (B) RNAi silencing of luciferase reporter activity is inhibited when Argonaute2 and Dcp1a are targeted by siRNAs when compared to a mock knockdown. N = 3 replicates per data point. *P < 0.001 compared to mock IP, Student’s t-test. (C) Quantitative RT–PCR of targeted luciferase mRNA immunoprecipitated with antibodies to the indicted proteins. Cell extracts were obtained after cells were induced to express miRNA for 24 h. Input is RNA extracted directly from cell extracts. The mRNA levels were normalized to mock immunoprecipitation (mock = 1). The line is the mRNA level of the mock immunoprecipitation. N = 2 replicates per data point. Error bars = standard deviation. (D) Western blot of the RNA IP shows that the protein is immunoprecipitated by the antibody. The sample (S) for each RNA IP was run in between the input (I) and a mock IP control (M). Antibodies used are noted to the left of the images.

