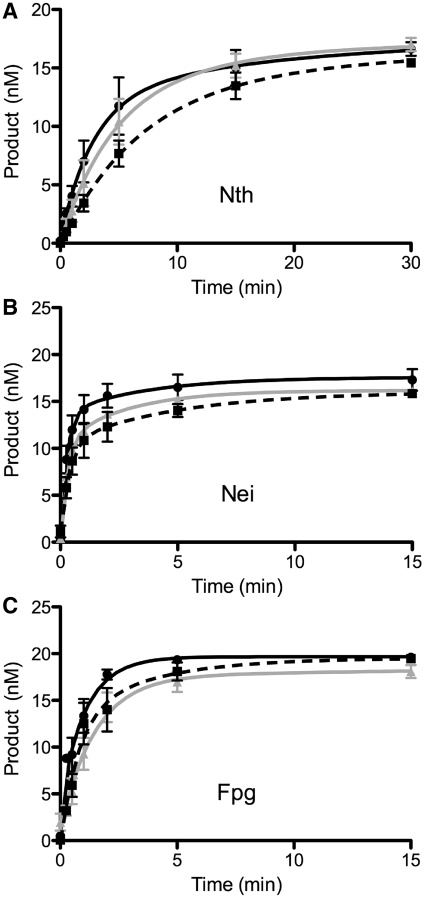
Figure 2.
Gel-based glycosylase assays under single molecule conditions. Time course reactions contained 20 nM substrate and 2 nM of Nth, Nei or Fpg enzyme. Black curve/filled circles represent the control oligodeoxyribonucleotide substrates containing either a thymine glycol lesion opposite A for Nth and Nei or an 8-oxoguanine lesion opposite C for Fpg. Gray curve/filled triangles depict reactions where the oligodeoxyribonucleotide substrates had been pretreated with 10 pM YOYO-1. Dashed black curve/filled squares represent reactions where the glycosylase was conjugated to a quantum dot. Error bars represent SEM. (A) Nth; (B) Nei; (C) Fpg.

