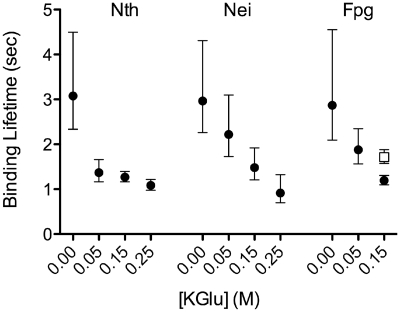
Figure 3.
Salt dependence of the mean binding lifetime for Nth, Nei and Fpg. The open square represents FpgFIIIA. The mean binding lifetime represents the period of time from initial glycosylase binding to dissociation from the DNA. Values were generated from single-exponential fits to binding lifetime histograms at 0.00, 0.05, 0.15 and 0.25 M KGlu (Supplementary Figure S2). Error bars represent SEM.

