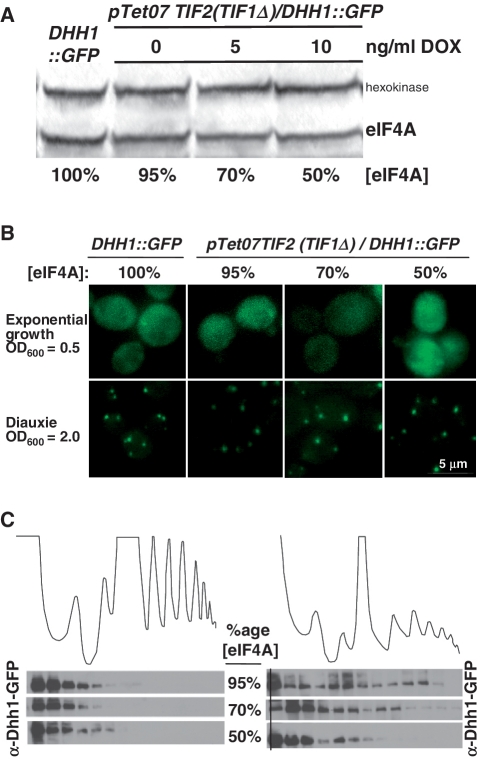
Figure 6.
Subcellular localization of Dhh1-GFP in a ptet07::TEF2 (TEF1Δ) strain at different doxycycline levels. (A) Western blot showing repression of eIF4A expression by addition of different amounts of doxycycline. Relative expression levels of eIF4A were determined by labelling with a FITC-conjugated secondary antibody, followed by visualization with a Typhoon Biomolecular Imager (GE Healthcare) and analysis using ImageQuant software, using hexokinase as a loading control. The far-left lane (labelled DHH1::GFP) shows the expression levels of hexokinase and eIF4A in a control strain in which the DHH1::GFP fusion is transcribed from the natural chromosomal promoter. The other three lanes show, as labelled, 95% expression (0 ng/ml DOX—the promotor substitution induces a 5% decrease in expression level compared to wild-type), 70% (5 ng/ml DOX) and 50% (10 ng/ml DOX). (B) Cells were treated as in panel A and then grown to an OD600 = 0.5 (exponential) or OD600 = 2.0, were visualized on a Deltavision microscope and then 3D projections were generated from 50 serial Z-axis images collected at 0.1-micron intervals. (C) Cells expressing 95, 70 or 50% of the wild-type level of eIF4A were harvested during exponential (left) or retardation phase (diauxic growth shift; right) growth and extracts from these cells were then analysed by polysomal gradient fractionation. Corresponding polysomal gradient fractions were collected and proteins resolved by SDS–PAGE and probed using anti-GFP antibodies to determine the distribution of Dhh1-GFP.

