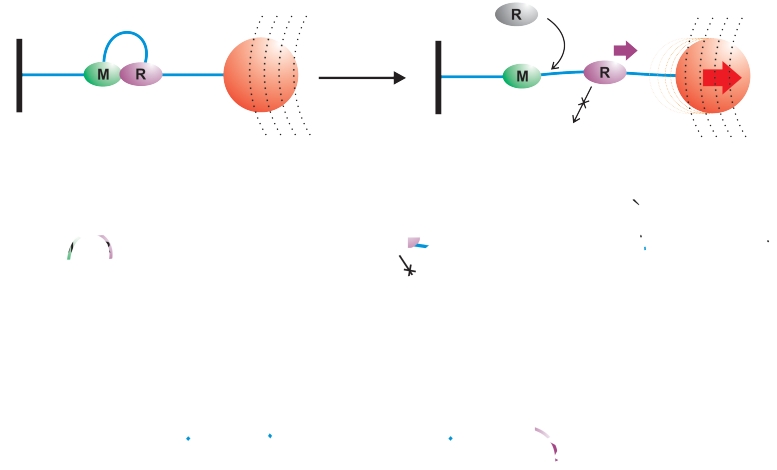
Figure 6.
Fates of HsdR subunits on different DNA substrates in vitro following dissociation from the MTase core. DNA is represented as a blue line, the MTase (i.e. both the HsdM and HsdS subunits) as a green oval (M) and HsdR as a purple oval (R). (A) Tethered DNA in a magnetic tweezers apparatus. The coverslip surface is shown as a black line, the magnetic bead as a red circle and the magnetic field as a series of dotted lines. (B) Linear DNA in solution. (C) Circular DNA in solution.

