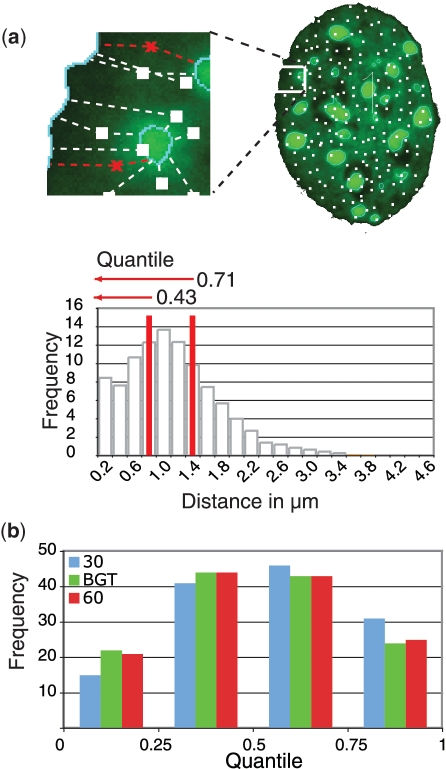
Figure 2.
Single cell-based normalization overcomes threshold dependent variability. (a) For data normalization, 10 000 random points were set throughout the 3D nuclear volume (Supplementary Movie 2) and all distances from these points (white) to the chosen nuclear landmarks measured. The target gene locus measurement (red) is set in relation to the random distribution obtained by the simulation. The fractions of random point measurements, which are smaller or equal to the gene locus distance measurements, are defined as quantile. (b) Gene loci distance measurements in MEF were normalized to a random distribution and the resulting quantiles plotted for each threshold setting (n = 133).

