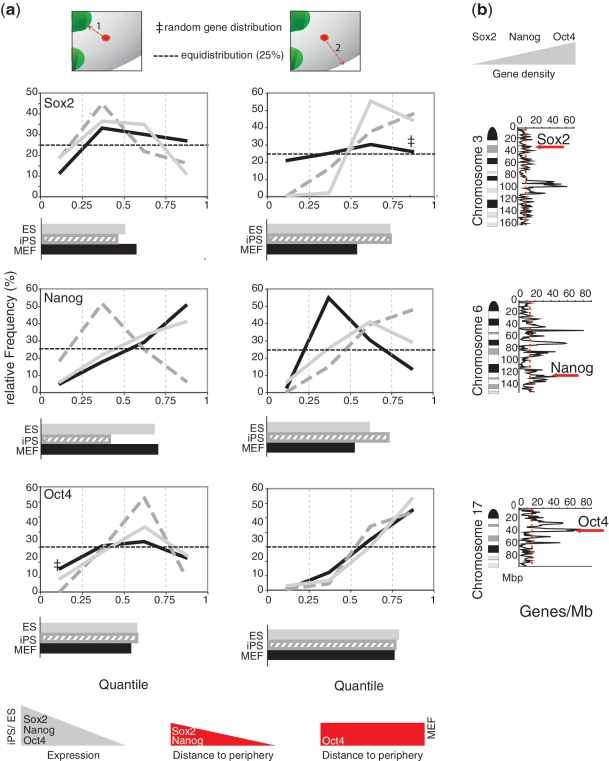
Figure 3.
Gene repositioning during gain/loss of pluripotency relative to chromosomal context and to distance from heterochromatin. Distances of pluripotency genes Sox2, Nanog and Oct4 to chromocenters and to the nuclear periphery in MEF, ES and iPS cells were normalized as shown in Figure 2A. (a) Quantile distribution relative to chromocenters (1) and to nuclear periphery (2) with histogram of the average quantiles underneath. A summary of expression and re-localization of the genes in the nucleus is added at the bottom. (b) Position of the genes within the corresponding mouse chromosome ideogram (Giemsa banding) with gene density plotted along the chromosome.

