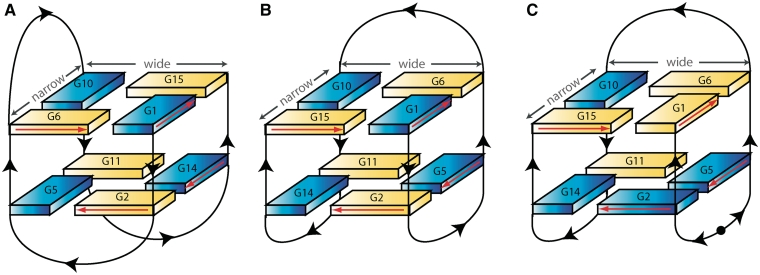
Figure 1.
Schematic illustration of (A) X-ray model of TBA (14), (B) NMR model of TBA (12,13), (C) solution (21) and crystallographic (present paper) model of the modified aptamer (mTBA). Black arrows indicate 5′→3′ polarity of the strands. Black circle in mTBA represents the 5′–5′ polarity inversion site. Anti and syn guanines are depicted as yellow and blue solids, respectively. Wide and narrow grooves are explicitly indicated in the three pictures. Red arrows indicate the direction of the proton donors and acceptors in Hoogsteen hydrogen bonds.

