
Figure 8.
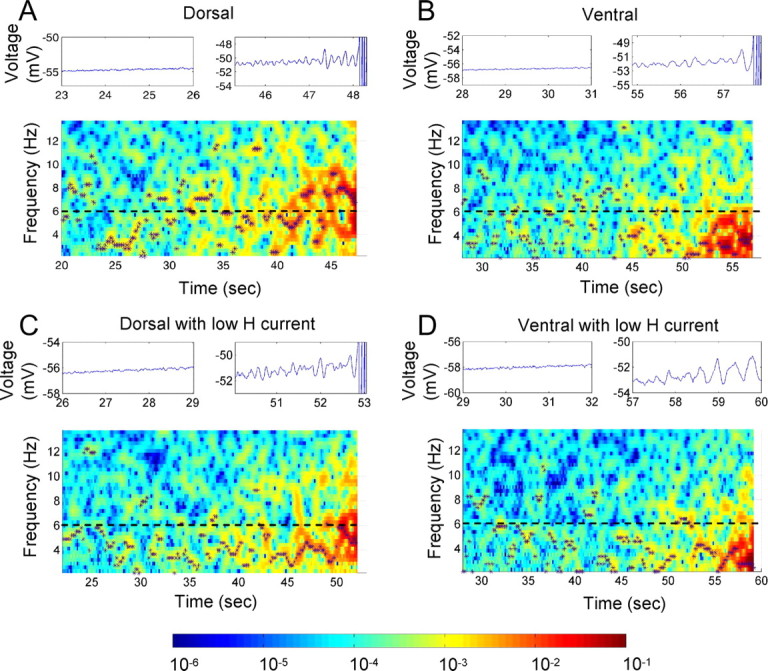
Ramp simulation results for the single-compartment model medial entorhinal cortex II stellate cell in four parameter configurations. A depolarizing direct current was applied, linearly increasing from rest potential until threshold was reached and spikes were observed, and the PSD (in square millivolts per hertz) of the resulting membrane potential was calculated over the simulation time before the first spike was observed. A–D, The four conditions were the h current fast time constant model for a typical dorsal cell (A) and for a typical ventral cell (B), using parameters from voltage-clamp data (Giocomo and Hasselmo, 2008), and (C) h channel density reduced by half for the dorsal fast time constant model and (D) for the ventral time constant model. For each ramp, the top left plot shows a segment of the voltage trace in the broadband region, and the top right plot shows a segment of the voltage trace for the same duration as the left plot but in the narrowband region of high depolarization up to and including the first spike events. In the PSD spectrograms, the local maximum PSD value at each analysis time interval is marked by an asterisk. The color bar shows the PSD scale in mV2/Hz. The h channel conductance density for A and B is 0.169 mS/cm2, and for C and D it is 0.0845 mS/cm2.