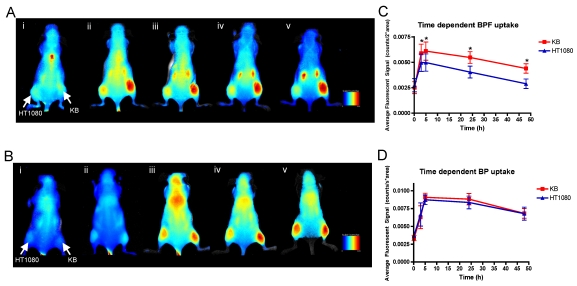
Figure 3.
Spectral reflectance fluorescence images of tumor-bearing mice with KB (high FR expressing, right flank) and HT1080 (low FR expressing, left flank) xenografts. Mice were administered with 25 nmol (in 200 μL) of A) BPF and B) BP and imaged i) 10min, ii) 3h, iii) 5h, iv) 24h, v) 48h post intravenous injection. The in vivo time dependent KB versus HT1080 tumor uptake of C) BPF and D) BP is quantified based on the average fluorescent signal (counts/sec*area). Data are expressed as mean values + SEM (n=5) where * indicates p <0.05.

