Figure 2.
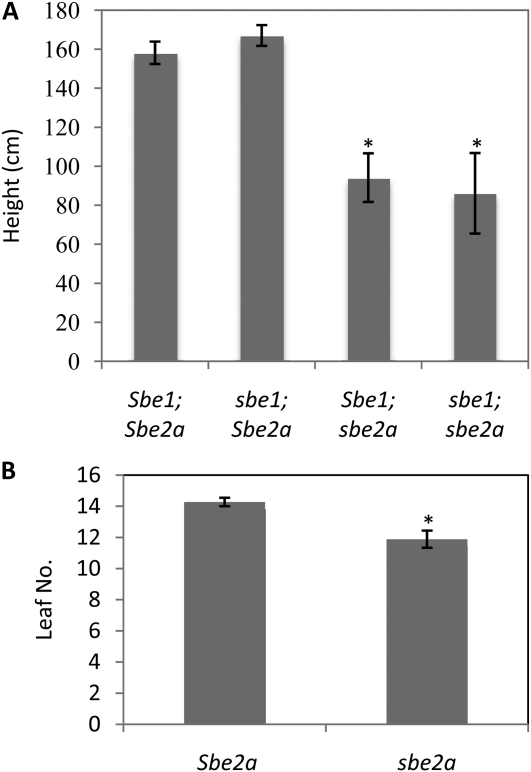
sbe2a plants have reduced height and leaf number. A, Plant height was measured after anthesis in Sbe2a and sbe2a plants grown in 2006 (n = 51) and 2007 (n = 162). Because statistical differences were not seen between years for each genotype, the average over 2 years is shown. Asterisks denote significant differences in height in the sbe2a mutant as compared with the Sbe2a classes (P < 10−3). B, Leaf number was counted at maturity for Sbe2a (n = 30) and sbe2a (n = 16) plants. The asterisk denotes that the value significantly differs from the wild type (P < 0.01). Error bars represent se.

