Figure 2.
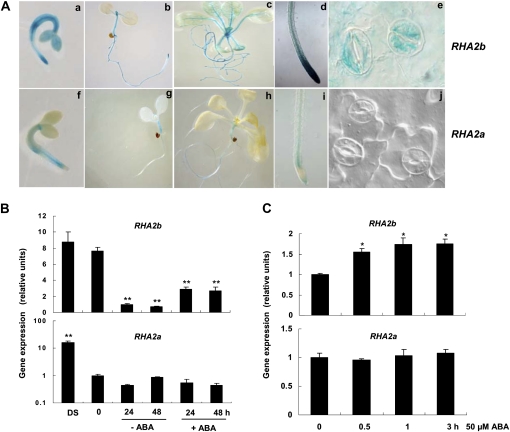
Comparison of RHA2b and RHA2a expression. A, pRHA2b:RHA2b-GUS and pRHA2a:RHA2a-GUS seedling staining. a and f, Two-day-old germinating seedlings. b and g, Seven-day-old seedlings. c and h, Fourteen-day-old seedlings. d and i, Primary roots of 7-d-old seedlings. e and j, Guard cells in leaves of 14-d-old seedlings. B, RHA2b and RHA2a expression pattern in dry seeds (DS) and during seed imbibition revealed by qRT-PCR. Imbibed seeds were kept in darkness at 4°C for 72 h and then transferred to medium with or without ABA (5 μm) in constant light at 22°C for germination. Total RNA was extracted at the indicated times (0 indicates the time immediately before transfer). Transcript levels were quantified by qRT-PCR against ACTIN2. Data shown are means ± sd of three independent biological determinations. C, ABA-induced RHA2b and RHA2a expression revealed by qRT-PCR. Two-week-old wild-type seedlings were treated with 50 μm ABA for 0, 0.5, 1, and 3 h. ACTIN2 primers were used as an internal control. Data shown are means ± sd of three independent biological determinations. Asterisks in B and C indicate significant differences from the corresponding control values determined by Student’s t test (* 0.01 ≤ P < 0.05, ** P < 0.01).

