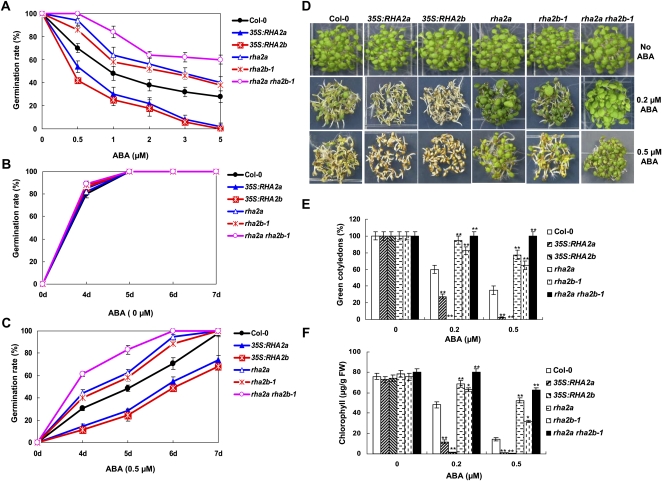
Figure 3.
ABA responses of Col-0, 35S:RHA2a, rha2a, 35S:RHA2b, rha2b-1, and rha2a rha2b-1 plants in seed germination and postgerminative growth. A, Seed germination percentage of the indicated genotypes grown on different concentrations of ABA was recorded at 3 d after the end of stratification. Data shown are means ± sd of three replicates. At least 100 seeds per genotype were measured in each replicate. B and C, Seed germination time course of the six genotypes grown on medium without ABA (B) or containing 0.5 μm ABA (C). Data shown are means ± sd of three replicates. At least 100 seeds per genotype were measured in each replicate. D, Photographs of young seedlings at 5 d after the end of stratification. Seeds were germinated and allowed to grow on horizontal agar medium containing 0, 0.2, and 0.5 μm ABA. E, Cotyledon greening percentage of the seedlings described in D. Values represent means ± sd of three replicates. At least 30 seedlings per genotype were measured in each replicate. F, Quantification of chlorophyll content. Seedlings described in D were collected for chlorophyll a/b extraction and measurement. Values represent means ± sd of three replicates. FW, Fresh weight of whole seedlings. Asterisks in E and F indicate significant differences from the corresponding wild-type values determined by Student’s t test (* 0.01 ≤ P < 0.05, ** P < 0.01). At least three independent experiments were conducted, and similar results were obtained.

