Figure 7.
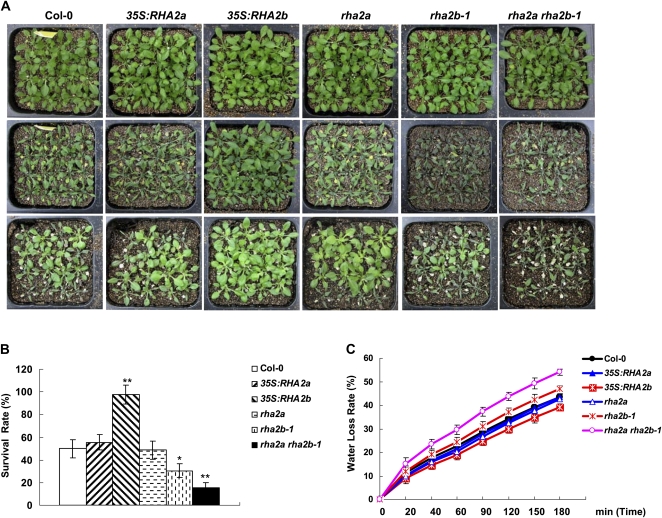
Drought responses of Col-0, 35S:RHA2a, rha2a, 35S:RHA2b, rha2b-1, and rha2a rha2b-1 plants. A, Drought tolerance assay. Seven-day-old seedlings were transferred to soil for another 2 weeks (top row), subjected to progressive drought by withholding water for specified times (middle row), and then rewatered for 2 d (bottom row). B, Survival rate of the plants from A after rewatering; sd (error bars) was calculated from results of three independent experiments (n > 30 for each experiment). Asterisks indicate significant differences from the corresponding wild-type values determined by Student’s t test (* 0.01 ≤ P < 0.05, ** P < 0.01). C, Water loss rate. Leaves of the same developmental stage were excised and weighed at various time points after detachment. Values are means ± sd of three individual plants per genotype. Experiments were repeated at least three times with similar results.

