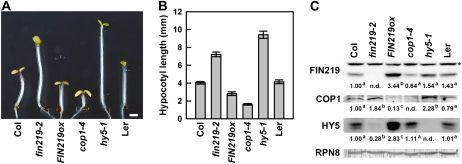
Figure 2.
Levels of COP1 are negatively regulated by FIN219. A, Phenotypes of FIN219-overexpressed transgenic seedlings under cFR light. Phenotype examination of 3-d-old wild-type Col, fin219-2, FIN219ox, cop1-4, hy5-1, and Landsberg erecta (Ler) seedlings is shown (n = 30). B, Quantitative analysis of hypocotyl lengths of the seedlings shown in A. Data represent results of at least two replicates (n = 30). C, Protein gel-blot analysis of COP1 and HY5 in FIN219-overexpressed seedlings grown under cFR light. Protein extracts were isolated from the seedlings shown in A and then underwent protein gel-blot analysis with FIN219, COP1, and HY5 polyclonal antibodies. Each lane contained 100 μg of total protein. RPN8 was a loading control. The numbers below each blot represent relative expression ratios normalized to RPN8 expression; the level of wild-type Col was arbitrarily set to 1. Different lowercase letters represent significant differences by ANOVA at P < 0.05. The asterisk indicates artificial bands. The FR fluence rate is 1.47 μmol m−2 s−1. [See online article for color version of this figure.]

