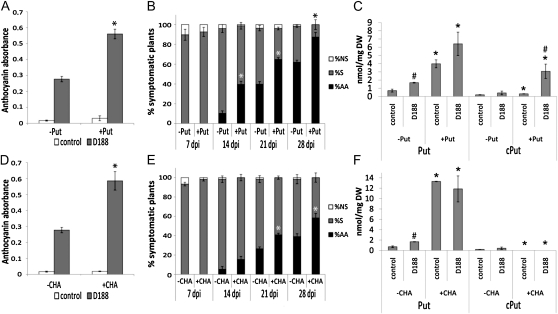
Figure 4.
Effects of modulating the endogenous Put pool on symptom development and on Put levels in R. fascians-infected Arabidopsis Col-0. Error bars indicate se (n = 3). Statistical differences were evaluated with Student’s t tests. Asterisks indicate statistical differences (P < 0.05) between Put-treated (A–C) or CHA-treated (D–F) and untreated plants. A to C, Put modulation accomplished by addition of 1 mm Put 10 d before infection. A, Anthocyanin accumulation at 28 dpi. B, Kinetics of symptom development. AA, Symptomatic plants exhibiting activation of the axillary meristems; NS, nonsymptomatic plants; S, symptomatic plants exhibiting anthocyanin accumulation, swollen veins, and/or serrated leaves. Statistical analysis was done on axillary activation, the most important plant response upon infection. C, Free and conjugated Put levels measured at 14 dpi. Hashes indicate statistical differences (P < 0.05) between D188- and mock-infected (control) samples either in the absence of presence of Put. DW, Dry weight. D to F, Put modulation accomplished by treatment with the SPDS inhibitor CHA (1 mm) just before infection. D, Anthocyanin accumulation at 28 dpi. E, Kinetics of symptom development. Statistical analysis was done on axillary activation. F, Free and conjugated Put levels measured at 14 dpi. Statistical analysis was done as in C.

