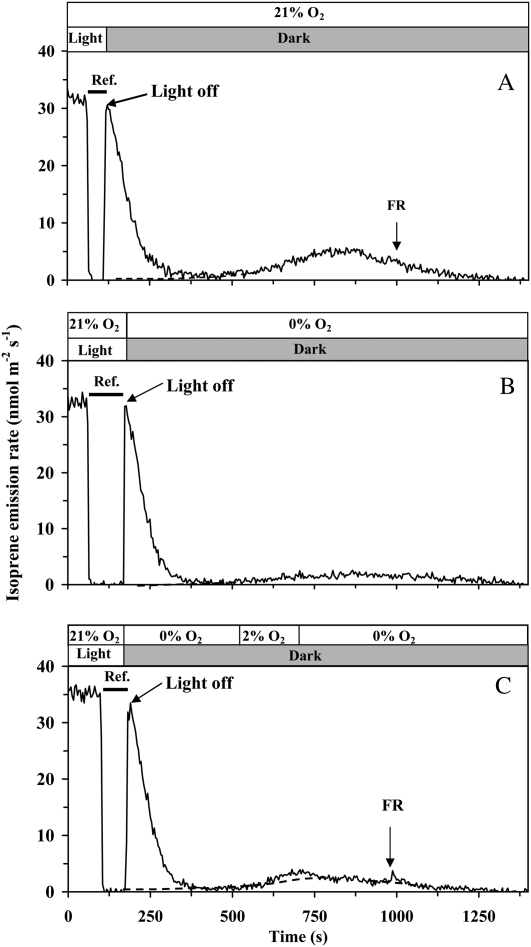
Figure 5.
Comparison of the effects of oxygen concentration and far-red light (FR) during light/dark transients on the dark-decay kinetics of isoprene emission. In A, the whole postillumination process was measured under 21% oxygen. In B and C, oxygen concentration was changed to 0% simultaneously with switching off the light. In B, oxygen concentration was maintained at this level until the end of the transient, while in C, oxygen concentration was temporarily raised to 2% between 600 and 700 s. In all cases, quantum flux density prior to darkening was 600 μmol m−2 s−1, and CO2 concentration was maintained at 360 μmol mol−1 throughout the experiment. Horizontal bars denote the periods when the measurement system was switched to the reference line.

