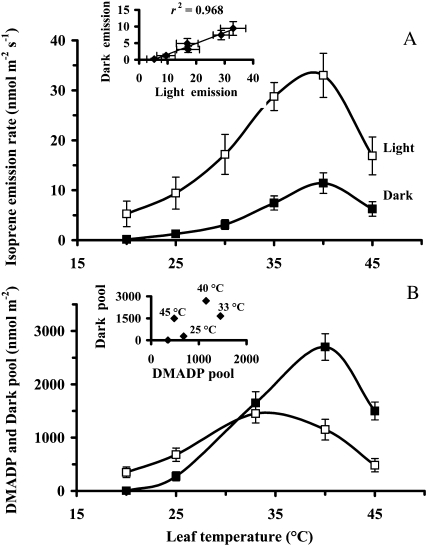
Figure 6.
Temperature dependencies of the steady-state isoprene emission rate in the light and the following maximum rate of dark-induced emission (A) as well as the corresponding DMADP and dark pool sizes (B). The inset in A demonstrates the correlation between the steady-state emission rate in light and the maximum dark-induced emission rate measured under different temperatures, while the inset in B shows the corresponding relationship between the dark pool and the DMADP pool. At least four replicate experiments were conducted, and the error bars correspond to sd. The definitions of terms are as in Figure 2. Ambient CO2 concentration was maintained at 360 μmol mol−1, oxygen concentration at 21%, and quantum flux density was 600 μmol m−2 s−1 prior to darkening.

