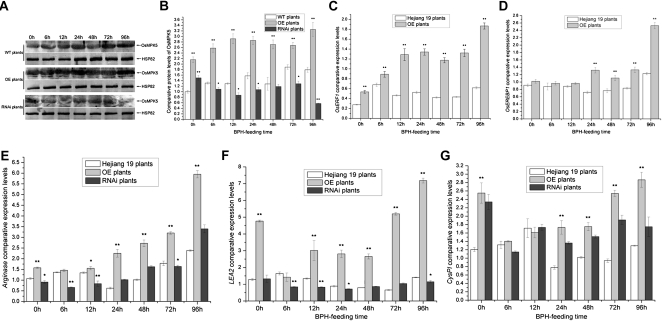
Figure 8.
A, Immunoblot analysis of OsMPK5 in transgenic and wild-type (WT) plants after the BPH had been feeding for between 0 and 96 h. Protein (50 μg) was separated by SDS-PAGE, electroblotted, and probed with rabbit OsMPK5 polyclonal antibody (1:1,000). After incubation with goat anti-rabbit IgG (1:10,000) conjugated to alkaline phosphatase, the complex was visualized using 5-bromo-4-chloro-3-indolyl phosphate/nitroblue tetrazolium solution. Rice HSP82 (Q69QQ6) mouse monoclonal antibody (1:10,000) was used as a loading control. B, Comparative protein levels of OsMPK5 in wild-type and transgenic plants from three replicates. The western-blot signals of OsMPK5 were analyzed with Quantity One (Bio-Rad) and are shown with a histogram. C to G, Comparative expression levels of OsERF1, OsEREBP1, Arginase, LEA2, and CysPI after the BPH had been feeding for between 0 and 96 h in wild-type and transgenic plants. Each bar represents the mean value ± se of three replicates. Significant differences in B to G are indicated with asterisks (* P < 0.05, ** P < 0.01, by Student’s t test).

