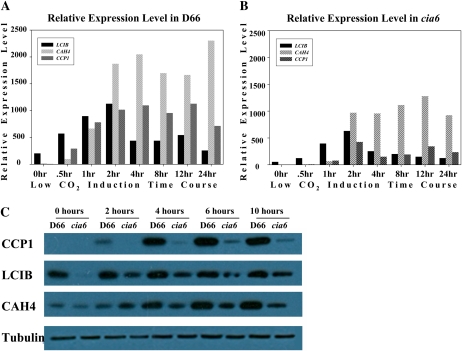
Figure 9.
Time course of LCIB, CAH4, and CCP1 levels during the low-CO2 induction process as measured by quantitative RT-PCR (A and B) and western blotting (C). A, Wild-type D66 cells subjected to low-CO2 induction were sampled at the time points indicated. The CBLP gene was used as the internal control. B, Mutant cia6 cells subjected to low-CO2 induction were sampled at the time points indicated. The CBLP gene was used as the internal control. C, Wild-type D66 and mutant cia6 protein samples were collected at the time points indicated and then subjected to western-blot analysis using antibody raised against CCP1, LCIB, and CAH4. Anti-α-tubulin antibody was used as a loading control. [See online article for color version of this figure.]

