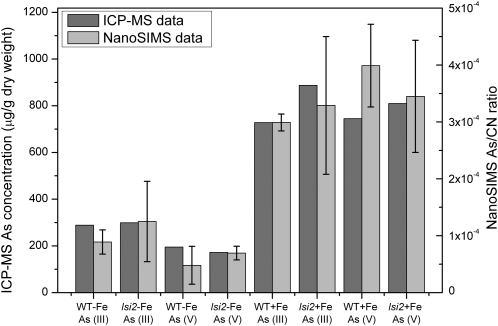
Figure 8.
ICP-MS and nanoSIMS data for each treatment. ICP-MS data show the total concentration of As in the roots. The nanoSIMS data show the summed (edge and stele) 75As−/12C14N− ratio and have been scaled to the wild-type (WT) + Fe As (III) ICP-MS data for comparison. Error bars on the nanoSIMS data represent the summed sd values from the edge and stele regions. ICP-MS analysis was performed on one replicate of the root samples.

