Abstract
Myosin motors transduce ATP free energy into mechanical work. Transduction models allocate specific functions to motor structural domains beginning with ATP hydrolysis in the active site and ending in a lever-arm rotating power-stroke. Myosin light chains, regulatory (RLC) and essential (ELC), bind IQ-domains on the lever-arm and track its movement. Strong evidence exists that light chains stabilize the lever-arm and that light chain mutation undermines stability. Human ventricular RLC tagged with photoactivatable GFP (HCRLC-PAGFP) replaces native RLC in porcine papillary muscle fibers, restores native contractility, and situates PAGFP for single molecule orientation tracking within the crowded fiber lattice. The spatial emission pattern from single photoactivated PAGFP tagged myosins was observed in z-stacks fitted simultaneously to maximize accuracy in estimated dipole orientation. Emitter dipole polar and azimuthal angle pair scatter plots identified an area where steric and molecular crowding constraints depopulated orientations unfavorable for actin interaction. Transitions between pre- and post-power-stroke states represent the lever-arm trajectory sampled by the data and quantify lever-arm shear strain in transduction at three tension levels. These data identify forces acting on myosin in the in situ fiber system due to crowding, steric hindrance, and actomyosin interaction. They induce lever-arm shear strain observed with single molecule orientation detection. A single myosin work histogram reveals discretized power-stroke substates reminiscent of the Huxley–Simmons model for myosin based contraction [Huxley and Simmons (1971) Nature 233, 533]. RLC or ELC mutation, should it impact lever-arm shear strain, will be detected as changes in single myosin shear strain or power-stroke substate distribution.
Myosin is an actin-dependent molecular motor driving sarcomeric shortening and muscle contraction by transducing ATP hydrolysis free energy into directed protein movement.1 Cardiac myosin consists of a heavy chain, MHC, and two light chains, regulatory (RLC) and essential (ELC). MHC has the N-terminal globular head called cross-bridge or subfragment 1 (S1) and a dimer forming C-terminal tail. Elliptically shaped S1 (~130 × 70 Å) contains function-assigned subdomains that retain their structure, but move relatively, during transduction. Figure 1 identifies several important function-assigned subdomains on the ventricular S1 structure homology modeled from the skeletal myosin crystal structure, 2mys.2
Figure 1.
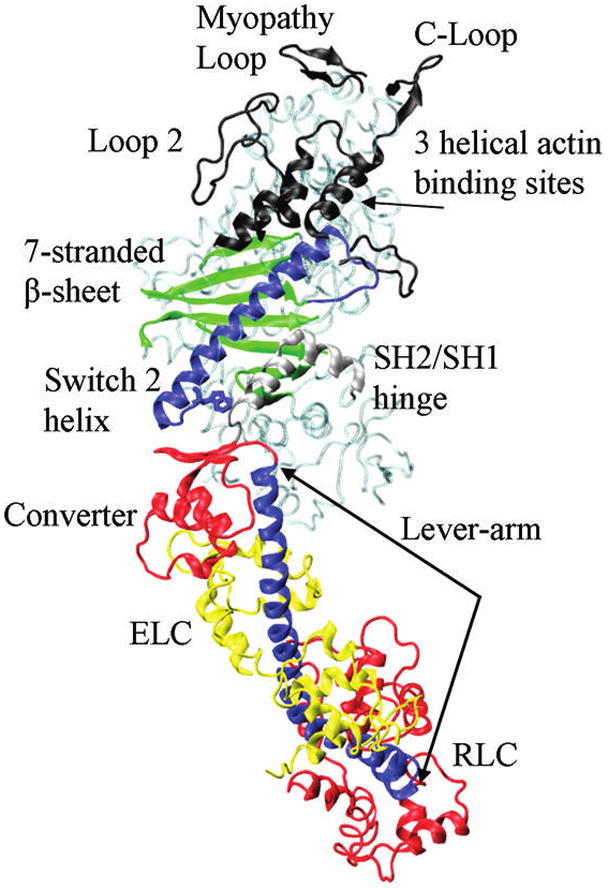
Functional-assigned subdomains of cardiac ventricular S1 participating in energy transduction. The lever-arm is the single α-helix stabilized by myosin essential (ELC) and regulatory (RLC) light chains. The lever-arm and light chains undergo a large rotation during the power-stroke and repriming steps.
A model for myosin transduction starts in the active site where peptides linked to the 7-stranded β-sheet sense position and coordination of the ATP γ-phosphate. ATP hydrolysis occurs rapidly but products are not released until actin binds. The C-loop actin binding site senses and communicates the actin contact to the 7-stranded β-sheet releasing product and translating the switch 2 α-helix.3 Switch 2 helix linear movement impinges on the converter changing linear force into torque to rotate the lever-arm while a region between the switch 2 helix and the converter domain, the SH2/SH1 hinge, undergoes substantial conformation change. The lever-arm α-helix, rigidified by the bound MLCs, amplifies displacement and impels myosin relative to actin.
Scheme 1 indicates the chemical cycle for cardiac myosin (M) and actin (A) and with broad blue or red arrows showing the predominant pathway. Myosin transient intermediates M, M*, M**, and M^, corresponding to distinct myosin conformations, segregate into strong (M and M^) and weak actin binding (M* and M**) states. Strong binding states (dissociation constant Kd ~ 1 nM) are force bearing states where myosin does mechanical work. Weak actin binding states (Kd ~ 10–100 μM) facilitate cross-bridge repriming. Phosphate release is rate limiting in the absence and presence of actin (broad red arrow) with actin binding accelerating release 10–100-fold. The weak-to-strong actin binding transition at the red arrow is the power-stroke accomplished with lever-arm rotation.
Scheme 1.

The focus of this work is on the lever-arm rotation in a permeabilized porcine papillary muscle fiber detected using fluorescence from a GFP tagged RLC. The GFP is made photoactivatable (PAGFP) by insertion of a mutation into the wild-type GFP sequence.4 The RLC-PAGFP specifically replaces the native RLC in the permeabilized fiber without compromising contractility when exchange efficiency is ~60%. A sparse population of PAGFP in the microscope detection volume can be photoactivated inside the crowded environment of the muscle fiber permitting the total internal reflection fluorescence (TIRF) detection of single molecules. Single molecule detection facilitates the “bottom-up” description of a dynamic system that can be formulated and tested without the ambiguities inherent in ensemble derived observations.5 The approach utilized here directly detects the GFP dipole orientation by linking it to a spatially resolved emission pattern.6,7 Novel to this application is the use of z-stack imagery to boost accuracy of the single dipole orientation estimate from photoactivated RLC-PAGFP exchanged cross-bridges. Implications from this work will begin to assess the impact of crowding on normal myosin functionality when single molecule results reported here are compared to in vitro single molecule findings where crowding effects are absent.
Both cardiac MLCs contain disease-linked mutations and functional studies have been done on RLC mutations implicated in familial hypertrophic cardiomyopathy (FHC). FHC linked mutant E22K expressed in transgenic mice had hearts with signs of interventricular septal hypertrophy and enlarged papillary muscles8 while skinned papillary fiber preparations had decreased maximal force and ATPase compared to WT.9 In vitro experiments on cardiac myosin isolated from transgenic mice expressing the FHC linked R58Q mutation displayed a reduction in isometric force and ATPase increase compared to WT, indicating a loss of work production efficiency potentially leading to compensatory hypertrophy.10 These data suggest that some FHC-linked RLC mutations impact lever-arm structural stability and rigidity to degrade motor work producing effectiveness leading to heart disease. We show here how single cross-bridge experiments in the crowded environment of normal permeabilized cardiac papillary fibers detect lever-arm shear strain induced by specific lattice forces during contraction providing the baseline in situ test of lever-arm stability and rigidity.
METHODS
Chemicals
ATP, CDTA, dithiothreitol (DTT), and phenyl-methanesulfonyl fluoride (PMSF) were from Sigma Chemical (St. Louis, MO). Leupeptin was from Peptides International (Louisville, KY). Recombinant human cardiac troponin-C (TnC) was from Life Diagnostics (West Chester, PA). All chemicals were analytical-grade or Ultra-Pure if available.
Preparation of Human Ventricular Myosin Light Chain
The cDNA of wild-type human cardiac ventricular myosin regulatory light chain (HCRLC) was a generous gift from Dr. D. Szczesna-Cordary, University of Miami. For GFP-tagged HCRLC, the HCRLC C-terminal was modified with the peptide GGGGGGVPVEK-GFP (HCRLC-GFP), then cloned, expressed, and purified as described.11 GFP was converted to a photoactivatable form (PAGFP) with T203H and V163A substitutions generated in GFP using Quickchange site-directed mutagenesis (Stratagene, La Jolla, CA), then cloned, expressed, and purified also as described.12 T203H converts the chromophore to the photoactivatable form while V163A enhances folding kinetics.4
Purified tagged HCRLC is stored in elution buffer consisting of 2 M urea, 25 mM Tris, 1 mM DTT, pH7.5, 0.1 mM PMSF, 1 μg/mL leupeptin, and 50–500 mM KCl. When needed, stored tagged HCRLC was dialyzed overnight in 0.5 M KCl, 25 mM Tris pH 8.5, 1 mM DTT, 0.1 mM PMSF, 1 μg/mL leupeptin to remove urea, then dialyzed in 0.1 M KCl, 20 mM imidazole pH 7, 1 mM DTT, 0.1 mM PMSF, 1 μg/mL leupeptin for 3–4 h, and spun down for 30 min to remove aggregates. Protein concentration measured with Bradford assay is ~100 μM. Immediately before use, we added 10 μL of 0.1 M ATP, 4 μL of 1 M phosphocreatine, 2 μL of creatine kinase, 6 μL of 0.2 M MgCl2, and 7 μL of 0.1 M EGTA (reconstitute solution) to 200 μL of tagged HCRLC and then split the volume into two 100 μL aliquots. One aliquot is for the second fiber reconstitution step. To the other aliquot we added 5 μL of 300 μM TnC for the first fiber reconstitution step.
Fiber Solutions
Fiber solutions are based on the protocol from Szczesna-Cordary et al.13 Table 1 lists the chemical composition and ionic strength of solutions used on fibers. Rigor, relax, and active solutions were adjusted to 150 mM ionic strength by varying potassium propionate (KPr) concentration and using the program FIBER PCA.xls to estimate total concentrations of species.14 Extract solution ionic strength was estimated assuming full dissociation of Tris (charge z = +1) and KCl. Reconstitute solution ionic strength was estimated by iteratively adjusting the target ionic strength in FIBER PCA.xls until total concentration of KCl was 100 mM.
Table 1.
Final Concentrations (in mM) of Chemical Species in Solutionsa
| species | rigor | relax | active | extract | reconstitute |
|---|---|---|---|---|---|
| KPr | 106 | 29.3 | 14.5 | ||
| MgCl2 | 1.2 | 6.6 | 6.4 | 6.7 | |
| CaCl2 | 0.17 | 0.17 | 7.4 | 0.16 | |
| EGTA | 7 | 7 | 7 | 7 | |
| ATP | 6.0 | 6.25 | 6.3 | ||
| PCr | 20 | 20 | 20 | ||
| imidizole (pH 7) | 20 | 20 | 20 | 20 | |
| Triton X100 | 0 (1% skin) | 1% | 0.1% | ||
| Cr kinase | 15 U/mL | 15 U/mL | 15 U/mL | ||
| DTT | 1 | 1 | 1 | 1 | 1 |
| CDTA | 5 | ||||
| Tris | 40 (pH 8.4) | ||||
| leupeptin | 1 μg/mL | 1 μg/mL | 10 μg/mL | 10 μg/mL | |
| PMSF | 0.1 | 0.1 | 0.1 | ||
| KCl | 150 | 100 | |||
| TnC | 0.015 | ||||
| HCRLC-GFP | >0.100 | ||||
| ionic strength | 150 | 150 | 150 | ~210 | 220 |
Abbreviations used are propionate (Pr), and phosphocreatine (PCr). HCRLC-GFP corresponds to both HCRLC-GFP and HCRLC-PAGFP.
Other buffers used in the preparation of porcine papillary fibers are physiological salt solution (4 mM KCl, 1.8 mM CaCl2, 1.0 mM MgCl2, 1.8 mm NaHPO4, 5.5 mM glucose, 50 mM imidazole pH 7.4 and 140 mM NaCl), dissecting solution (relax solution with 15% v/v glycerol), skinning solution (relax solution with 1% v/v Triton X100), skinning/glycerinating solution (relax solution with 1% Triton X100 and 50% glycerol), and storage solution (relax solution with 50% glycerol).
Fiber Preparation
3 mm diameter solid glass rods were cut to 8 cm lengths, buffed using a Dremel tool or fine sand paper to roughen, then rinsed in distilled water, and dried in the oven at 120 °C. A freshly harvested porcine heart was cooled immediately in an ice–water bath for ~5 min and opened, and the left ventricle was removed using a scalpel with care taken to identify and preserve intact papillary muscles. We rinsed the ventricle in physiological salt solution, cut papillary muscles into 2 × 30 mm longitudinal strips using a scalpel, and then tied strip ends to the glass rods with silk suture tight enough to keep fibers isometric but without cutting the tissue. The rod with attached fiber was immediately immersed in storage solution on ice. All fiber preparations were done in the cold room. Dissected fibers remained in storage solution for 1 h, placed in ice cold skinning/glycerinating solution for 24 h, then exchanged with storage solution, and stored at −20 °C for 2–3 days. Individual rods with attached fiber strips were placed in 10 mL aliquots of storage solution in Falcon tubes for long-term storage. Fibers remained vital for 1–3 months.
Fiber Dissection and Mounting
Fibers were removed from storage solution and placed on a dissecting microscope stage. With a small scissor, we cut a fiber bundle from the tissue on one end of the glass rod then slowly pulled the bundle away from the rest of the tissue using a tweezer. The separated bundle was cut from the muscle with the scissors then placed in a cold Petri dish and covered with cold dissecting solution. With two tweezers, we slowly teased the large bundle into several smaller bundles consisting of 3–10 fibers each (width 50–100 μm) and 2–3 mm long. We transferred one freshly dissected fiber bundle onto a glass slide and covered with ice cold dissecting solution. The slide rested on top of a cold aluminum block that kept the fiber bundle cold as it was mounted on the tension machine. We used the slide/block to bring the small fiber bundle close to the tension transducer for mounting.
Tweezer mounts on the tension transducer and fixed end (Standard System with Muscledata software, MKT2 table holding several 1.5 mL and 100 μL incubation cuvettes at constant temperatures using a water bath, and KG4 transducer, SI Instruments Heidelberg) were replaced with equivalent diameter and length stainless steel rods with a 90° bend at the extreme end near the sample. The bend extends 2 mm of the shaft parallel to the benchtop. We wrapped the fibers 1–2 turns around the short shaft and fixed with a small amount of acetone diluted Duco cement applied at the extreme outer edges of the coiled fibers. The glue does not resist the pull of fiber tension but only serves to stabilize the wrapped coil while in the bathing solution. Friction supplies the resisting force between the stainless shaft and wrapped fiber bundle. The 1.5 mL cuvettes were prefilled with relax, active, skinning, and extract solutions, and the mounted fiber was immediately immersed in relax solution. We started the Muscledata program to record tension vs time. After completing tension measurements, we raised the mounted fiber bundle from solution into the air and placed a small amount of dissecting solution on the fiber to stop it from drying out. We detached the fiber bundle from the tension transducer by sliding the wrapped fiber bundle off of the metal shafts, placed the sample in a linear geometry on a glass slide, and then severed the glue from the undamaged fiber center with a scalpel. The undamaged fiber is then ready for microscope experiments or protein extraction and SDS/PAGE.
Fiber Preparations for Microscope Measurements
We coated a #1 glass coverslip with nitrocellulose to promote uniform fiber adhesion by the following steps essentially as described previously:15 (a) Clean coverslip by sonicating for 10 min in ethanol then plasma cleaning for 15 min. (b) Fill a 10 cm diameter Petri dish with distilled water, and then in a well-ventilated area apply 50 μL of 1% nitrocellulose (ultrapure, Ernst Fullam, Latham, NY) in amyl acetate to the surface. (c) After the amyl acetate evaporates, gently place 3–4 coverslips on the surface such that the nitrocellulose membrane contacts the glass without air pockets. (d) Lay plastic wrap over the surface and contacting the coverslips and then lift up plastic wrap and coverslips with one movement. (e) Remove the coverslips with a fine tweezer from the plastic wrap and lay, coated surface up, on filter paper to dry. Use slides immediately.
We placed the coverslip, coating-side-up, on a 1 × 3 in. stainless steel slide with a large hole cut out permitting the inverted microscope objective to contact the coverslip through immersion oil from below. Extruded Apiezon grease (Apiezon Products M & I Materials Ltd., Manchester, UK) in two parallel lines on the coverslip forms the sides of the chamber for solution exchange after the fiber is mounted. We placed the tagged fiber, removed from the tension transducer as described in the preceding section and with the minimum accompanying solution, at the center of the coverslip and quickly glued the ends to the coverslip with a small amount of acetone diluted Duco. The glue does not flow onto the fiber before drying if the dissecting solution accompanying the fiber is kept to a minimum. Small mats of tape over the glued ends protect the glue/glass bond from the aqueous solutions introduced subsequently. We covered the fiber with 100 μL relaxing solution and then placed spacers on the coverslip outside of the extruded grease. The spacers are strips of #1 coverslip cut from a new glass coverslip that forms the top of the chamber containing the fiber. The shortened coverslip allows access to the fiber bathing solution for solution exchange. Following microscope experiments we saved the fiber for SDS/PAGE analysis.
SDS/PAGE from Fiber Extracted Proteins
Light chain exchange efficiency was measured by detecting loss of native RLC and replacement with GFP-tagged HCRLC by SDS-PAGE on proteins extracted from the muscle fibers. Untreated and light chain exchanged fiber bundles, each consisting of 3–10 single fibers, were added to 20 μL of SDS-PAGE sample buffer consisting of 2% SDS. Samples were incubated for 3 min at 100 °C and then allowed to cool to room temperature for 30 min. The sample is briefly centrifuged and the supernatant run on a 15% SDS-PAGE slab gel. Following electrophoresis, the gel was treated for 10 min with fixating solution (9% acetic acid and 50% ethanol) and then incubated at room temperature overnight in SYPRO Ruby protein stain solution (Bio-Rad, Hercules, CA). The gel was incubated at room temperature for 1 h in destaining solution (9% acetic acid, 10% ethanol). SYPRO Ruby fluorescence is excited by near-UV light. A digital camera captured the fluorescent images from behind a filter transmitting fluorescence light with wavelengths 600 ± 40 nm. Digital images were analyzed with ImageJ by integrating over the band intensities.
Microscopy
Figure 2 shows the Olympus IX71 microscope with excitation and emission detection pathways. Internal electronic shuttering in the diode laser briefly pulses the 405 nm light. The pulse reflects from the external dichroic mirror (eDM) and then enters the epi-illumination port of the microscope. The internal dichroic mirror (iDM) reflects exciting light that undergoes through-the-objective total internal reflection (TIR) and photoactivates HCRLC-PAGFP reconstituted in the papillary fiber on the microscope stage. Penetration depth of the 405 nm light is <100 nm, thereby selectively photoactivating single molecules in a narrow plane on the surface of the fiber. The 488 nm light transmits the eDM before entering the epi-illumination port, reflecting at the iDM, and undergoing TIR to selectively illuminate the photoactivated GFP and excite fluorescence. The penetration depth of the 488 nm light is ~100 nm and deeper than the 405 nm light due to refractive indices wavelength dependence at the glass/aqueous interface. Light polarization from either beam is controlled independently by a polarizer (P) and manual polarization rotator (PR). Activateable shutters (AS) control exciting light entering the epi-illumination port and emitted light entering the electron multiplying CCD (EMCCD) camera.
Figure 2.
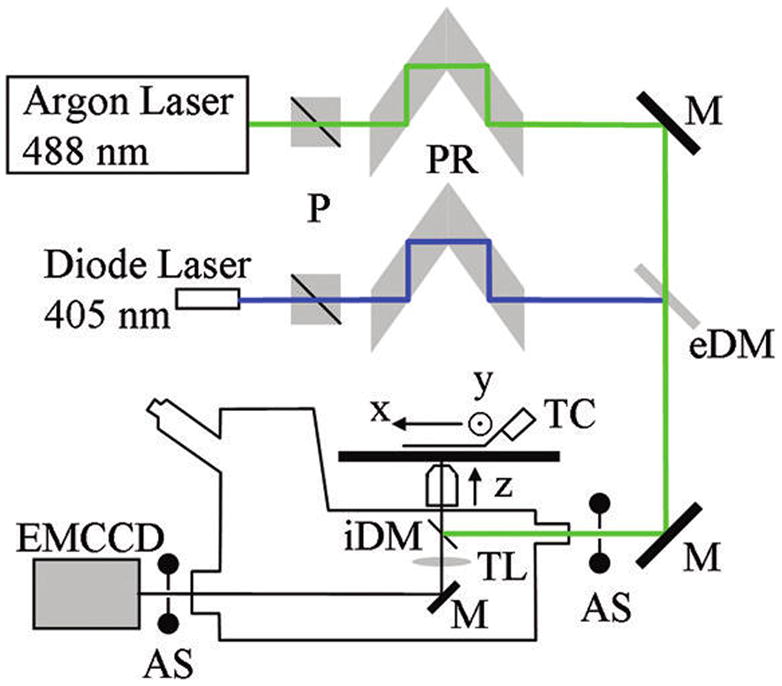
Microscope setup measuring single molecule emission patterns. Photoactivation (405 nm) and excitation (488 nm) beams use a Glan–Taylor polarizer (P) and polarization rotator (PR) to independently control light polarization. Single molecules are photoactivated by a brief pulse of 405 nm light and then imaged using continuous 488 nm excitation. The external dichroic mirror (eDM) reflects 405 nm light and transmits 488 nm light facilitating superposition of photoactivating and exciting light beam paths. Mirrors (M) reflect both wavelengths. The internal DM (iDM) reflects both 405 and 488 nm light while transmitting PAGFP emission ≳ 500 nm. The tube lens (TL) images emission collected in the 100×, 1.49 NA objective on the EMCCD. Objective magnification and EMCCD pixel size match to resolve features of the emission spatial pattern distinguishing varying PAGFP dipole orientation. Programmable nanopositioners move the sample in the microscope stage plane, and the objective moves along the z-axis to accomplish z-scanning imagery. Activatable shutter (AS) at the EMCCD camera is programmed to be closed during photoactivation by the 405 nm beam pulse. The second AS at the laser beam input to the microscope is under manual control.
The high numerical aperture objective (100×, 1.49 NA) collects emitted light that transmits the iDM and is focused by the tube lens (TL) into a real image on the EMCCD camera (Hamamatsu C9100–13, Hamamatsu City, Japan). Nano-positioning translators (MCL, Madison, WI) move the specimen in 2 dimensions on the stage and the objective for z-scanning imagery. The stage temperature controller (TC) maintains constant sample temperature.
A Labview (National Instruments, Austin, TX) routine and drivers supplied by the manufacturers exert overall computer control of the microscope. The Labview routine coordinates: (i) the photoactivation light pulse with movement of the AS to cover the EMCCD during the pulse and (ii) image capture by the EMCCD with the movement of the various translating elements in or around the microscope. Translating elements were controlled via USB interface (MCL nanopositioners). HCImage software (Hamamatsu) coordinates synchronous capture of a new image frame while storing data from the previous frame following triggering by the Labview program via a counter output TTL pulse (NI6602).
For TIRF microscopy, laser excitation is focused on the back focal plane of the objective and incident from the glass side of a glass/aqueous interface at angles greater than critical angle for TIR. The p-polarized incident light has electric field polarization in the incidence plane and produces an elliptically polarized evanescent electric field. Evanescent intensity is predominantly polarized normal to the interface.16 The s-polarized incident light has electric field polarization perpendicular to the incidence plane that is continuous across the interface. For a muscle fiber, || (parallel) or ⊥ (perpendicular) means relative to the fiber symmetry axis. The incident beam always propagates along the interface in a direction perpendicular to the fiber symmetry axis; hence, p (s)-polarized incident TIR light produces the ⊥ (||) excitation. We utilize only p-polarized photo-activation and exciting light in this study (⊥ excitation).
A HCRLC-PAGFP exchanged muscle fiber is illuminated by the evanescent field. Sparse PAGFP photoactivation was accomplished under TIR using a 100 μs pulse of a 50 mW beam from the 405 nm laser or a few seconds illumination by a 100 mW beam from the 488 nm laser. Photoactivated PAGFPs in the muscle fiber are apparently single molecules because their density in the fiber image implies infinitesimal probability for two photoactivated molecules to reside in one pixel. We verify single molecule detection by observing single photo-bleaching steps to background level intensity.
Fluorescence Data Analysis
Point objects viewed in a microscope have the objective point spread function (PSF) defining the narrowest photon distribution in 3 dimensions detectable by the instrument. The objective PSF correlated with the measured sample photon distribution identifies the distribution center with precision determined by S/N ratio rather than the PSF distribution width.17,18 Analogous techniques link PSF shape to the emitting probe dipole orientation.19–22 These methods extract more of the information content from the image compared to traditional orthogonal polarized intensity ratio; however, they require substantial intensity pattern analysis. The intensity pattern analysis conserves scarce photons from single molecule images that are lost in polarizing beam splitters separating the orthogonal polarization images. The latter is an important advantage in our application to GFP-tagged myosin cross-bridges in muscle fibers.
After propagation through the microscope optics, we devolve the point image spatial pattern into the six basis patterns by methods described previously.7 The basis patterns are constant, for a given microscope and dipole distance from the glass/aqueous interface under TIR illumination, and only their co-efficients change to fit an observed pattern image. In linear combination, they specify any single molecule emission pattern. Given the basis patterns, we invert an observed image to deduce their coefficients by using maximum likelihood fitting for Poisson distributed uncertainties. The coefficients for the basis patterns depend algebraically on the dipole orientation and establish the one-to-two correspondence between pattern and dipole moment orientations given by (θ, φ) and (π − θ, π + φ). Parameters θ, φ are defined relative to the x-, y-, and z-axis depicted in Figure 2 where the origin is at the glass/aqueous interface with +z pointing toward the aqueous side. In TIRF coordinates, θ is the polar and φ the azimuthal angle of the emission dipole. We will also use fiber coordinates parameters β, α that are polar and azimuthal angles of the emission dipole relative to the fiber symmetry axis. TIRF and fiber coordinates share the x-axis. For calculation of the basis patterns, the point source is 50 nm from the glass/aqueous interface (in the aqueous phase) as appropriate for TIR illumination.7 Basis pattern dependence on axial distance was discussed in detail previously.7
Figure 2 shows the 16 × 16 μm pixel EMCCD camera used in our experiments. We verified that the observed emission patterns will contain sufficient resolution to distinguish dipole orientation. Resolution is dependent on the objective NA and magnification. We computed the expected emission pattern from dipoles parallel or normal to the TIR interface and detected by the Olympus 100×, 1.49 NA TIRF objective by the methods described previously.7 Figure 3 shows a high-resolution pattern before projection onto the EMCCD for the dipole parallel (panel A) or normal (panel D) to the TIR interface. The high-resolution frames depict resolution at which we perform the computation. After projection onto the EMCCD camera, the parallel (panels B and C) and normal (panel E) dipole loose resolution but continue to distinguish each dipole component. The tight elliptical shape of the parallel dipole indicates in-plane orientation by the direction of its major axis. The spread-out donut shape of the normal dipole is easily distinguishable from other patterns due to the central dark pixel. Circular symmetry expected for the normal dipole pattern is broken by the presence of the iDM that preferentially transmits light polarized along the x-axis. Computations shown are for a dipole at the center of the frame. An asymmetrically placed dipole, within the central pixel but at the edge of the pixel boundary, does not confuse the characteristic pattern descriptors.
Figure 3.
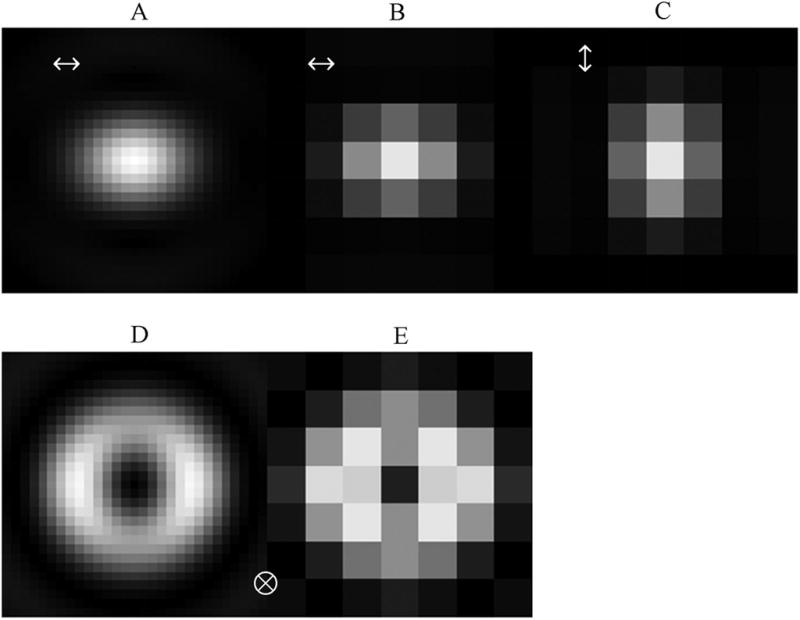
Emitted pattern spatial resolution for the EMCCD camera. Emission light collected by the 100×, 1.49 NA objective is projected onto 16 × 16 μm pixels. Expected emission patterns from dipoles parallel or normal to the TIR interface are shown at high resolution before (panels A and D) and after projection onto the EMCCD camera (panels B, C, and E). The tight elliptical shape of the parallel dipole indicates in-plane orientation by the direction of its major axis. The sprawling donut shape of the normal dipole is easily distinguishable from other patterns due to the central dark pixel. Circular symmetry expected for the normal dipole pattern is broken by the presence of the iDM that preferentially transmits light polarized along the x-axis.
Photoselection by Photoactivation
Total probe molecules N convert from unphotoactivated (NB) to photoactivated (NA) species by irreversible isomerization, NB → NA, where N = NB + NA. Solving for NA(t)
| (1) |
for kA the activation rate and tA the activating light pulse duration. Integrated absorption cross section, kA ∞ (μ̂a[B] · êpump)2, where μ̂a[B] is the absorption dipole moment for the unphotoactivated species (B-species with wavelength band near 405 nm) and êpump is the photoactivating (pump) light electric field polarization vector. Dipole moments for the photoactivated species (A-species with absorption wavelength band near 490 nm and emission band near 520 nm) are similarly defined with μ̂a(e),i[A], the absorption (emission) dipole moment for the ith molecule. For single molecule, the normalized probability for i its photoactivation, γA,i, is
| (2) |
where κ is a constant dependent on activating light pulse duration and other factors excluding probe dipole orientation. In all experiments κ is small to ensure that a sparse population of probes is photoactivated and to achieve the most selective orientation distribution of photoactivated probes. Photo-activation is a rare event with γA,i ≪ 1. Orientation of μ̂a,i[A] sets the absolute intensity of the emission pattern and is irrelevant for the single molecule analysis. Orientation of μ̂e,i[A] is the goal of the pattern recognition analysis.
z-Scanning Imagery
We showed previously that a series of point dipole source images taken while scanning the objective axial position (z-scanning imagery) decreased ambiguous assessments of single probe orientation in simulation.7 We utilized this strategy here on real data and demonstrate its effectiveness. The microscope objective was manually focused on the wide field image of the papillary muscle fiber sample “by eye”. An automated series of images were acquired from the sample as the objective position moved in the sawtooth trajectory shown in Figure 4. Many single molecule objects in the field of view were in-focus at step 21 where the objective is moving away from the sample but at the original position set manually. Objective movement was paused at each point depicted in the figure for enough time to acquire an image. The objective moved over a 2 μm distance in 100 nm intervals. We inspected the wide field z-scanning imagery for single molecules, defined a 7 × 7 pixel region of interest around each single molecule image, and then excised 5-frame (500 nm axial displacement) or 9-frame (900 nm axial displacement) scenes from the larger z-scan movie. The single in-focus image for the single molecule occupied position 3 (for the 5-frame scene) or position 5 (for the 9-frame scene). Most scenes were taken from the descending portion of the z-axis scan occupying steps 11–31, some were taken from the ascending branches of the trajectory, but no scenes included the inflection points where the objective reversed directions. During analysis, care was taken to ensure that frames were assembled into scenes depicting a descending objective; i.e., objective ascending scene frames were order reversed. We observed negligible evanescent excitation intensity variation over the objective z-scan distance (500–900 nm) included in a scene. We account for spherical aberration in the out-of-focus image during analysis of the z-scanning imagery.
Figure 4.
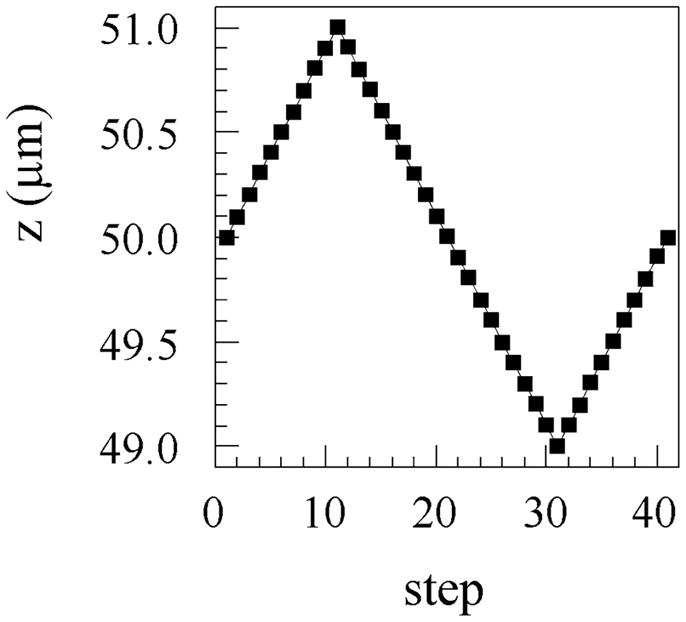
Axial objective scanning for acquiring z-scanning imagery. The objective is translated over 2 μm in 100 nm steps to perform the z-scanning. A full cycle, sawtooth, objective trajectory was chosen because it returns the objective to its original position after a linear (except where the objective reverses directions) translation excursion. Images are acquired at each point depicted in the figure as the objective pauses during scanning.
Fluorescence Spectroscopy
The HCRLC-PAGFP polarization anisotropy measurements reflect the rotational mobility of the chromophore under the circumstances encountered in the papillary fiber experiments. Previous work indicated the local and global environment of the chromophore is not significantly affected by the conditions under which the HCRLC-PAGFP chimera occupies the RLC binding site on the myosin lever-arm.12 The findings support the notion that differences in the dipole orientation distributions observed with the exchanged fiber reflect global myosin lever-arm properties rather than local chromophore properties.
RESULTS
Porcine Papillary Fiber Mechanics
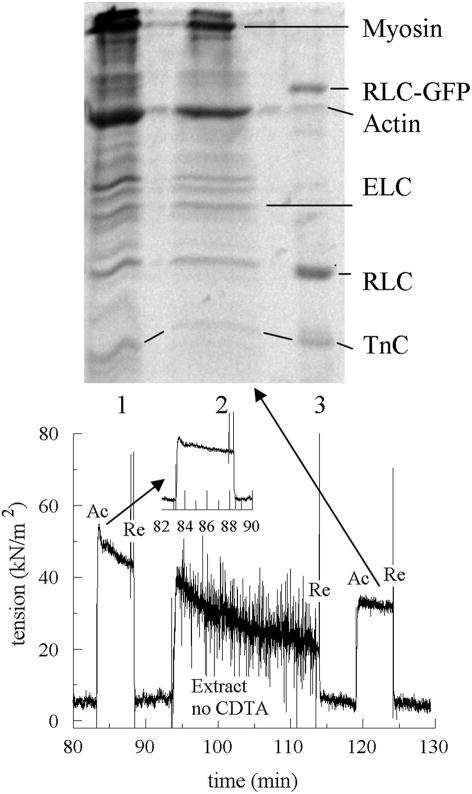
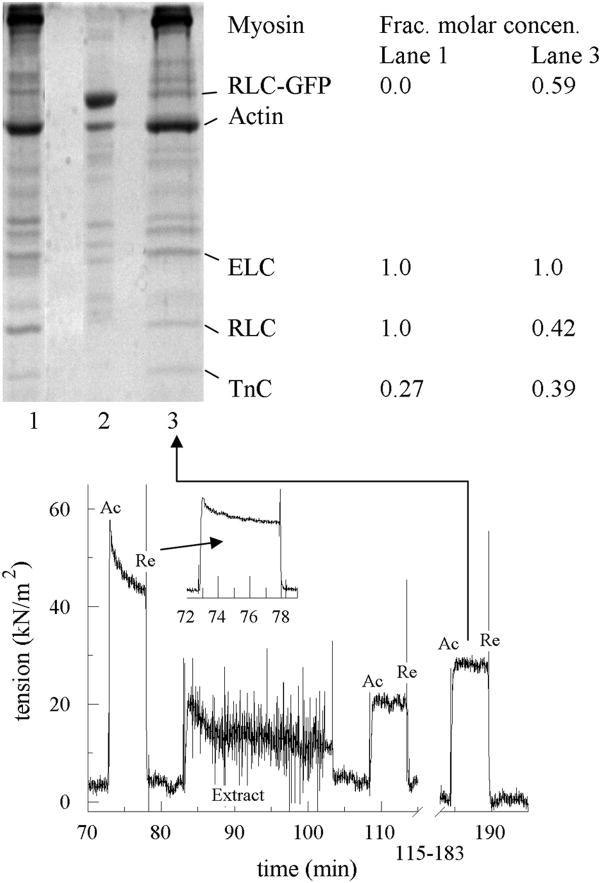
Fiber mechanical measurements are shown in Figures 5 and 6 A small bundle of 3–10 papillary muscle fibers is mounted on the transducer in dissecting solution, washed in relax solution, and then pulled to remove slack. It is washed in skinning solution for 1 h (2 × 30 min washes with 1 solution change) with rapid stirring to remove membrane, washed in relaxing solution, and stretched to 1.25 × resting length estimated to result in sarcomere lengths of 2.2–2.3 μm. The fiber is activated until reaching steady state (1–2 min), relaxed, and then activated again (Ac) and relaxed (Re) to establish the pretreatment level of isometric force. The fiber is placed in extracting solution without (protocol A) or with (protocol B) CDTA for 30 min with rapid stirring. (Rapid stirring causes the oscillation in the tension trace because the rotating magnet oscillates the transducer lever-arm.) In either protocol the fiber goes into rigor in the extracting solution, producing the rigor tension seen in the tension trace.
Figure 5.
SDS-PAGE of extracted fiber and protein samples and tension trace for a bundle of 3–10 permeabilized papillary muscle fibers. Top: lane 1 is untreated control fiber. Lane 2 is the fiber sample treated with the extraction solution without CDTA and giving the tension trace in the lower part of the figure. Lane 3 contains a mixture of purified HCRLC-GFP, actin, HCRLC, and TnC. Bottom: tension trace following the control fiber treatment in protocol A showing activation (Ac), relaxation (Re), and extraction without CDTA during the time course. Fiber active tension loss is an average of 20% from the initial activation (between 80 and 90 min and shown in the inset) to final activation after treatment with extracting solution without CDTA.
Figure 6.
SDS-PAGE of extracted then reconstituted fiber and protein samples and tension trace for a reconstituted bundle of 3–10 permeabilized papillary muscle fibers. Top: lane 1 is untreated control fiber. Lane 2 contains a mixture of HCRLC-GFP and actin. Lane 3 is the reconstituted fiber sample giving the tension trace in the lower part of the figure. The legend at the right shows the quantitation of protein content using fluorescence after sypro ruby staining of the control and reconstituted fibers. Fluorescence intensity shows equimolar content of ELC and RLC in the untreated fiber and fractional molar concentrations of 0.42 intrinsic RLC and 0.59 HCRLC-GFP compared to ELC in the reconstituted fiber. TnC fractional molar concentration increases in the reconstituted compared to untreated fiber. Similar results were obtained when wtHCRLC replaced HCRLC-GFP. Bottom: tension trace showing activation (Ac) and relaxation (Re) during the time course of the fiber treatment in Protocol B. Extraction with CDTA reduces starting fiber active tension (between 70 and 80 min and shown in the inset) by a factor of 0.55. This roughly correlates to the 0.59 HCRLC-GFP replacement of intrinsic RLC following reconstitution. After reconstitution tension returns to 0.92 of original value after correction for losses due to induction of the rigor state during extraction (see Figure 5).
Protocol A does not measurably extract the sacromeric proteins (see Figure 5). Following extraction, final isometric tension is measured. Comparison of final tension with the pretreatment tension shows that fibers did not recover 100% of their pretreatment tension. We also conducted measurements over the same time course except that extracting was replaced with relaxing solution. The later fibers showed no measurable decline in contractility, suggesting the pH 8.4 rigor state induced by the extracting solution caused a small fraction of heads to become irreversibly actin bound (dead heads). Addition of KCl to the extracting solution provided better recovery of pretreatment tension following extraction presumably by reducing the number of dead heads formed. Extraction with 150 mM KCl had fibers recovering 0.79 ± 0.08 (SD n = 7) of the pretreatment tension.
Protocol B (using CDTA) extracts the intrinsic RLC then reconstitutes with HCRLC-GFP or HCRLC-PAGFP (see Figure 6). After extraction, we measured active isometric tension to determine isometric force loss due to intrinsic RLC removal. Average residual tension was 0.41 ± 0.17 (SD n = 19) of initial tension. Extracted fibers were reconstituted with HCRLC-GFP or HCRLC-PAGFP in two 30 min steps. Step 1 reconstitution solution contains both the tagged light chain and TnC. Step 2 reconstitution contains just the tagged light chain (see Table 1). Following reconstitution, the final active isometric tension is measured. Average tension recovery is 0.92 ± 0.1 (SD n = 16 samples) of initial tension. Average residual tension following extraction of light chain and tension recovery following reconstitution includes the correction of 0.79 × initial tension to account for tension loss due to dead head formation. Reconstitution with HCRLC-GFP or HCRLC-PAGFP produced statistically identical contractility.
Single Molecule Orientation Measurements
Figure 7 shows a HCRLC-PAGFP exchanged cardiac papillary fiber in rigor under TIRF. The unitary bright spots are single photo-activated PAGFPs superposed on the background fluorescence from unphotoactivated weakly fluorescing PAGFPs. Varied single molecule intensities indicate varied dipole orientation relative to the excitation polarization or varied proximity to the TIR surface where evanescent field intensity is maximal. Background fluorescence is larger in comparison to skeletal fibers with similarly exchanged (~60%) cross-bridges.12 We observed that the cardiac papillary fibers were less homogeneous and tended to only occasionally contact the clean but untreated glass surface within the ~100 nm evanescent field depth. Larger (and sufficient) contact surfaces were achieved with the nitrocellulose coating (see Methods); nonetheless, the evanescent light scattering due to fiber inhomogeneity remained higher than with skeletal fibers, giving rise to larger background.
Figure 7.
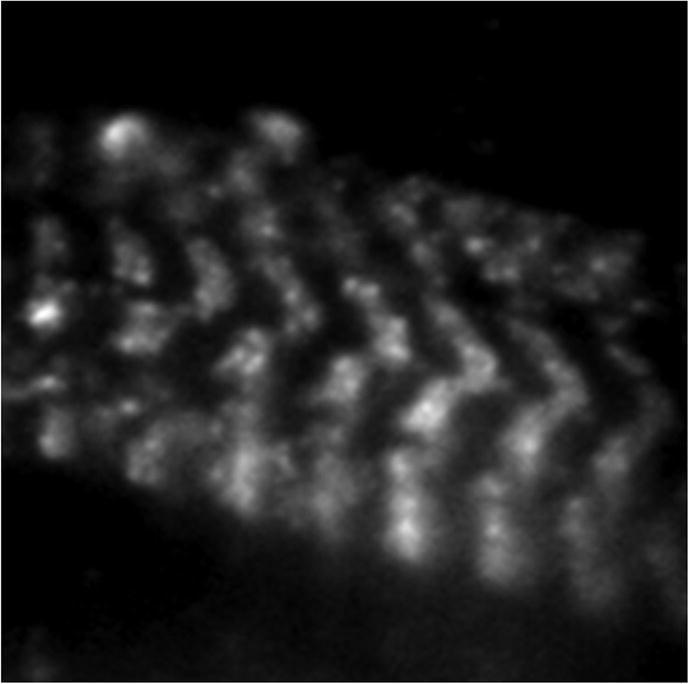
HCRLC-PAGFP reconstituted fiber under p-polarized TIR illumination. Image was taken with a 3 s exposure time using a 100×, 1.49 NA objective and 16 × 16 μm pixel EMCCD camera. Fluorescence shows the striated pattern of the myosin thick filaments. Single molecules are isolated bright spots of photoactivated PAGFP. Background comes from unphotoactivated PAGFP.
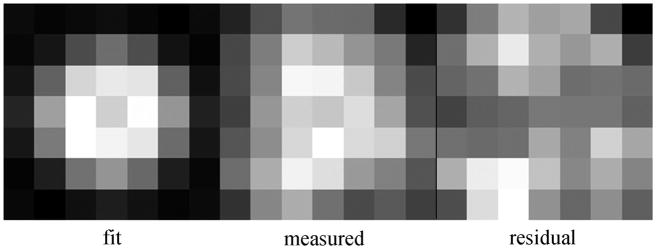
We measured and fitted the spatial intensity pattern emitted by the single photoactivated HCRLC-PAGFP’s on myosin in permeabilized cardiac papillary muscle fibers. The patterns were observed from muscle fibers in rigor, relaxation, and in isometric contraction. Figure 8 shows the intensity pattern from a cross-bridge in isometric contraction (middle panel), the fitted pattern (left panel), and the residual between observed and fitted images (right panel). The image has a donut shaped intensity that is indicative of a dipole moment nearly perpendicular to the TIR interface. The fitted image corresponds to a dipole orientation in TIR coordinates (θ, φ) = (34°, 80°) or in fiber coordinates (β, α) = (55°, 277°). We fitted images like that in Figure 8 for fibers in rigor, isometric contraction (in z-stacks of 5 images each on 24 different single molecules in each physiological state), and in relaxation (in z-stacks of 9 images each on 24 different single molecules) to obtain single dipole orientation angles in fiber coordinates.
Figure 8.
Intensity pattern from a single cross-bridge in isometric contraction. Shown are the measured and the fitted patterns and the residual between observed and fitted images.
One of the six basis patterns that span the spatial pattern space has a coefficient, designated c4, that sets the sign for (cos2θ)1/2 that is inverted to solve for θ. The wrong sign converts the correct θ to its complement π-θ, causing outliers in the dipole orientation distribution that was determined by fitting simulated data from a system with known dipole orientation distribution.7 The outliers occur when the c4 parameter standard error (SE, determined from the covariance matrix) is >|c4|. Increasing S/N ratio in simulation gradually eliminates the erroneous assignments. A different approach was tested in simulation that showed promise. Simulated images from an axial scan of the single molecule emitters produced the z-scan imagery described in Methods where images from above and below the nominal focal plane were fitted simultaneously to constrain the dipole orientation degrees of freedom. Scanning does not change dipole distance from the glass/aqueous interface, but the objective is moved these distances in the axial dimension. The z-scan data likewise greatly reduced outliers due to incorrect c4 sign assignment.
We performed z-scans using the nanoposititoner shown in Figure 2 and then computed the basis-pattern coefficients and their standard error using the z-scan images (data set A) and independently on different individual images (no z-scanning) of single molecules from in-focus frames (data set B). A and B data sets contained 120 frames for each fiber state and were collected over approximately the same time courses where 5 (rigor or active) or 9 (relax) frames collected in set A were collected in the time taken to collect one frame in set B (set B has higher S/N ratio per frame). We found that ≥33% of the c4’ s were significant such that SE < |c4| in data set A for the rigor and active fibers where 5 images formed the z-scan. This figure increased to 46% for relaxed fibers where 9 images formed the z-scan. In data set B, ≤5% of the c4’s were significant. These findings indicate the potential value of collecting and analyzing the more complex z-scan data set.
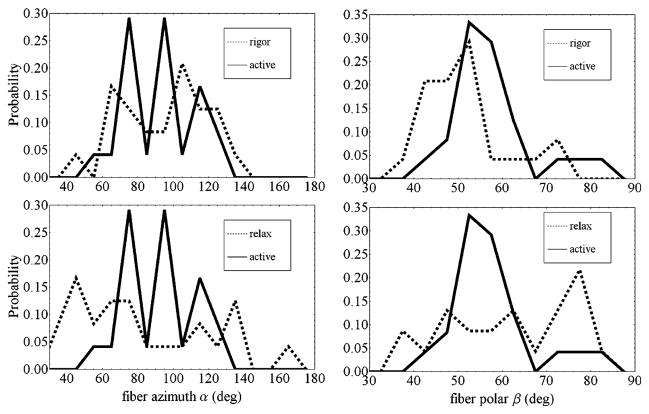
Figure 9 compares single molecule orientation distributions of fiber coordinates (β, α) measured from fibers in rigor, relaxation, and in isometric contraction. Table 2 summarized the statistical characterization of the lever-arm probe orientation distributions. Considering the α-degree of freedom first, p-polarized photoactivation activates probes along the fiber coordinates y-axis since this axis is perpendicular to the coverslip/aqueous interface where α = 90° or 270°. Average azimuthal angle from fibers in all states is ~90° (or equivalently ~270°) while distribution widths vary widely. The underlying fiber azimuthal symmetry is consistent with this observation since probe ordering in the α-degree of freedom is defined exclusively by the photoactivation photoselection.
Figure 9.
Probe orientation distributions from single cross-bridges in rigor, isometric contraction (active), and relaxation. The left and right columns compare distributions for the α- and β-degrees of freedom, respectively.
Table 2.
Statistical Summary of Single Lever-Arm Probe Orientation (in deg)
| 〈 α 〉 | (〈(α − 〈α〉)2〉)1/2 | 〈β〉 | (〈 (β − 〈β 〉)2〉)1/2 | |
|---|---|---|---|---|
| relax | 83.4 | 38 | 63.4 | 15.8 |
| rigor | 93.6 | 23.6 | 50.9 | 10.9 |
| active | 91.8 | 19.6 | 57.3 | 9.2 |
In the β degree of freedom, p-polarized photoactivation and intrinsic fiber ordering contribute to the observed probe distribution. This is clear from Table 2 where the predominant β differs from the photoactivating field polarization at 90°. Polar coordinate β maintains different average values and distribution widths for the fiber states. The distributions and statistics show highly and differently ordered rigor and isometrically contracting cross-bridges that contrast with the broad distribution in relaxed cross-bridges. Probe position on the RLC implies the involvement of the lever-arm orientation in maintaining the macroscopic properties of these physiological states. The rigor state maintains the rigor tension seen in Figures 5 and 6 during extraction. Isometric contraction maintains the active tension seen in Figure 6 following reconstitution.
Figure 10 shows a scatter plot of fiber coordinates (β, α) for active isometric (red ■), rigor (blue ■), and relaxed (□) individual cross-bridges. The plots indicate codependency information in the ordered pairs lost in the standard orientation distributions in Figure 9. We see that the extremes in the (β, α) domain, and in the central region where (β, α) ≈ (90°, 90°), are unpopulated by cross-bridges in the rigor, relax, and active states. The extremes are excluded experimentally by photo-selection from p-polarization photoactivation light. The central depletion zone is unexpected because photoselection from p-polarization photoactivation favors the region. Our findings show steric/molecular crowding constraints depopulate the central zone in favor of orientations that allow strong interaction with actin since favorable regions are roughly equivalent with and without strong actin binding. The steric/crowding constraints originate from the thick filament. The steric constraint is fundamentally linked to the reversal of myosin and actin polarity at the M-line in opposed half-sarcomeres. These forces are not replicated in vitro.
Figure 10.
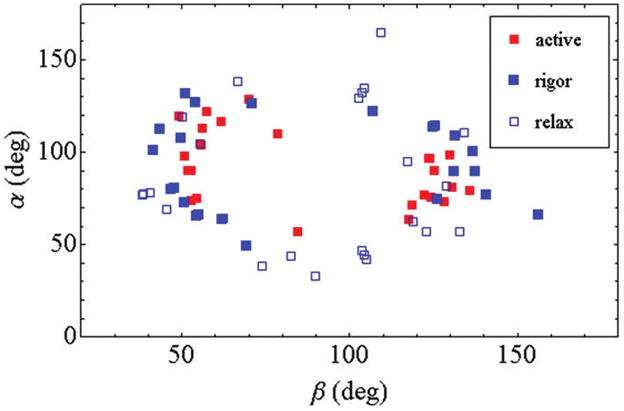
Scatter plot for single cross-bridge lever-arm probe (β, α) pairs for fibers in rigor (blue ■), active isometric contraction (red ■), and relaxation (□).
The rigor cross-bridge coordinates encircle active cross-bridge coordinates showing the lower free energy rigor state maintains the more extreme orientation compared to active. Relaxed cross-bridges more evenly fill the angle space occupying both extreme and intermediate orientations. Relaxed cross-bridges represent the pre-power-stroke state (Scheme 1, M* and M**) exerting no ensemble averaged macroscopic force on the fiber lattice under our conditions. Rigor and active cross-bridges are post-power-stroke (Scheme 1, M and distributed between M** and M^) since both states exert a measurable (but different amplitude) ensemble-averaged macroscopic force on the fiber lattice.
Weak actin binding pre-power-stroke cross-bridges convert to the strong binding state and exert force on the fiber lattice measured in rigor and active isometric states. Rigor cross-bridges are formed from a single turnover of ATP then product release. Single ATP turn over implies that cross-bridges releasing ATP hydrolysis product and reaching the free energy minimum remain there because they cannot detach and begin the cycle again. Active cross-bridges at the same point in the contraction cycle release and repeat the cycle until inhibited by resistance from the isometric fiber lattice. Fiber lattice resistance halts the active cross-bridge lever-arm rotation at a higher free energy than the rigor cross-bridge, giving rise to the encirclement of active cross-bridge coordinates relative to rigor seen in Figure 10.
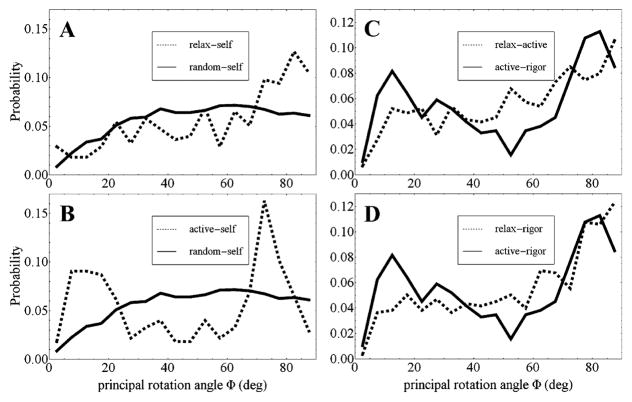
We computed the probe dipole moment principal angle rotation, Φ, from the inner product among dipole moments representing pre-power-stroke (relaxed single dipole orientation), post-power-stroke (active isometric or rigor dipole orientation), and hypothetical random states. Φ represents the α and β degrees of freedom of two particular single dipole moments (four parameters) in one parameter relevant to the lever-arm function of impelling actin. We show that the Φ distribution from a single state population (self-transitions) indicates allowed rotations among dipoles affected by thick filament steric, molecular crowding, or actomyosin interaction constraints. Comparing Φ distributions from two state populations indicates how dipole rotation is impacted by low, high, or intermediate cross-bridge tension for relax–rigor, relax–active, or active–rigor transitions, respectively.
Figure 11A shows the Φ distribution from simulated random dipoles (random–self transition) where their orientation is not affected by constraints (solid line). The relatively flat probability density increases gradually and then stabilizes over the 0° ≤ Φ < 90° domain reflecting the higher countable transitions as Φ increases. The relax–self overlay (broken line) contains the added complexity of the thick filament steric/crowding constraints causing the depopulated zone at (β, α) ≈ (90°, 90°) without actomyosin interaction constraints. The relax–self has surplus probability at the high range, 70° ≤ Φ < 90°, and deficit in the remainder of the Φ domain. Thick filament steric/crowding constraints are responsible for the high range surplus because transitions occur across the depopulated zone. Figure 11B shows the active–self overlay on the random–self distribution. The active–self distribution has the added complexity of actomyosin interaction in addition to thick filament steric/crowding constraints. Surplus probability in the low range, 0° ≤ Φ < 25°, distinguishes the new thin filament induced constraint. It implies a less disperse lever-arm orientation conformation due to the actomyosin interaction since the probability density surplus occurs for small Φ.
Figure 11.
Principal rotation angle distributions. Panel A compares Φ distributions from the relax–self transition (broken line) and simulated random–self transition (solid line). Panel B compares the active–self transition (broken) with simulated random–self transition distributions. Panel C compares the intermediate-tension level active–rigor (solid) with high-tension level relax–active (broken) transition distributions. Panel D compares active–rigor with the low-tension level relax–rigor (broken) transition distributions.
Figure 11C overlays the intermediate-tension active–rigor transition and high-tension relax–active transition distributions. This case shows that lowering tension from the high-tension state affects both the thick filament steric/crowding and thin filament actomyosin constraint regions of the Φ angle domain, suggesting both thick and thin filament lattice elements destrain with decreasing tension. Figure 11D overlays the intermediate-tension active–rigor transition and low-tension relax–rigor distributions. It shows rising tension from the low-tension state impacts constraints acting at smaller Φ, suggesting thin filament lattice elements strain first with increasing tension. The thin filament lattice elements are apparently stiffer under fiber tension.
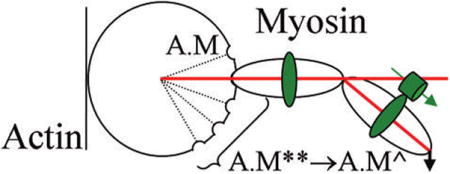
Figure 12 depicts the effect of lattice tension on the cross-bridge lever-arm and PAGFP tag orientation. The GFP dipole orientation reports the orientation of the lever-arm segment where RLC binds myosin. Tension in rigor (αF0, where α < 1) and active isometric (F0) states differently strain the cross-bridge lever-arm that is reflected by changes in the PAGFP dipole orientation. The shear strain angle, ξ, is defined for any cross-bridge by tan ξ = d/l, for d the deformation length and l the original length of the deformed member as defined in the figure. Evidentally, ξ = 0 in the relaxed state and in general
Figure 12.
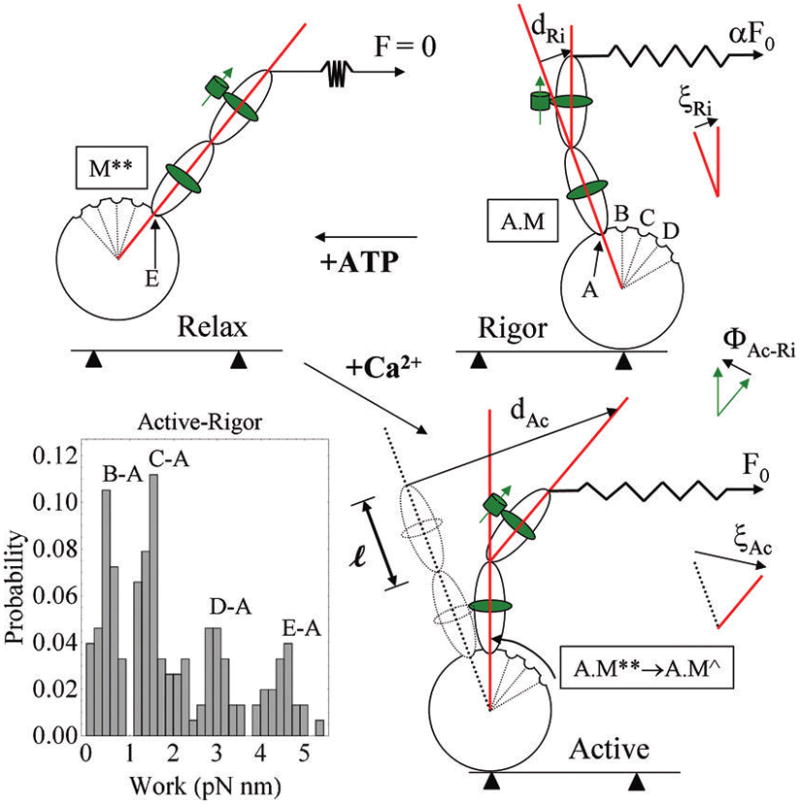
Myosin cross-bridge under rigor, relaxed, and active isometric conditions. The cross-bridge consists of an actin-binding globular domain and lever-arm with two light chains. GFP and its dipole moment are depicted as a green cylinder and arrow adjacent to RLC. Cross-bridges in rigor have different RLC-GFP orientations due to lever-arm deformation induced by the lattice force αF0 where α is a constant less than 1 and F0 is active isometric tension. The binding of ATP to myosin in rigor relaxes the cross-bridge, relieving shear strain and repriming the lever-arm. Addition of Ca2+ to the relaxed cross-bridge activates actin binding for active tension and shear strain development. tan ξ = d/l, for d the deformation length and l the original length of the deformed member, is the shear strain in active or rigor cross-bridges. The work histogram is computed using eq 4 and the active–rigor transitions with cos(ξAc − ξRi) = cos(ΦAc—Ri). The work histogram indicates substates in the power-stroke that we model as a series of attitudes labeled A–E that the lever-arm can assume during its swinging motion. Some of the biochemical states from Scheme 1 are assigned to the lever-arm attitudes including rigor (A.M, position A), relax after repriming (M**), or active (A.M**) (position E). Active state contains a series of substates (E–B) that upon transition to rigor give discretized peaks in the work histogram. The B → A transition is depicted in the figure but C → A, D → A, and E → A are also represented in the work histogram.
| (3) |
where ηi and ψi are the polar and azimuthal angles of the PAGFP dipole moments in state i relative to the shear strain plane, ξi is shear strain in state i, and ΦAc–Ri is the principal rotation defined as the intermediate-tension active–rigor transition distribution corresponding to the solid line in Figure 11C, D. Coplanarity of the shear strain and dipole moment plane (ψRi = ψAc = 0) is depicted in Figure 12 and implies cos(ξAc − ξRi) = cos(Φ Ac–Ri). The cross-bridge power-stroke stretches an elastic element in the fiber lattice modeled here as a spring with spring constant K. Hence, work done by one cross-bridge in the active–rigor transition depicted in Figure 12, W, is
| (4) |
for small sheer strain and coplanarity of the shear strain and dipole moments. Not every ΦAc–Ri in Figure 11C corresponds to a real work producing power-stroke because some of them belong to cross-bridges residing in opposite half-sarcomeres having transitions spanning the depopulated zone. Restricting ΦAc–Ri to real power-strokes, 0 ≤ ΦAc–Ri < 25, and eq 4 qualitatively relates work produced to observed Φ for transitions between strongly actin bound states in the same half-sarcomere.
Figure 12 shows the work histogram for 0 ≤ ΦAc–Ri < 25 using K = 2 pN/nm23 and l = 5 nm for the length of the RLC binding domain on the lever-arm. The power-stroke clears ~5 pN nm work compared to ~7 pN nm in optical tweezer experiments,24 rationalizing the cos(ξAc − ξRi) = cos(ΦAc–Ri) relationship. The discretized work histogram shown suggests mechanical substates in the myosin power-stroke. We propose that the mechanical substates A–E in Figure 12 correspond to positions that the lever-arm assumes relative to the motor domain during transduction. Rigor (A.M) has the lever-arm in position A, relaxation after repriming (M**) or active (A.M**) have lever-arm position E, and un-named active substates after A.M** but before A.M have lever-arm positions D, C, and B. The peaks in the work histogram associate with work producing transitions B → A, C → A, D → A, and E → A. The work histogram indicates the lowest free energy state transitions B → A and C → A are most likely and correspond to ~67% of the active–rigor work producing transitions.
Figure 13 compares the active–rigor transition work histogram with a similarly constructed relax–self work histogram. The relax–self work histogram is undiscretized as expected for an actin detached state that cannot produce work. The contrast with the active–rigor transition work validates the suggestion that the active–rigor transition work histogram is discretized.
Figure 13.
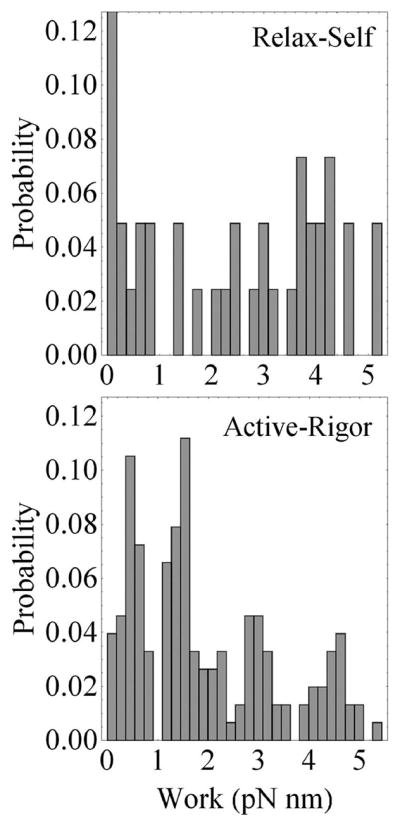
Relax–self and active–rigor transition work histograms contrast continuous and discretized work probabilities. ΦRe–Re’ s from Figure 11A are used in eq 4 to compute the relax–self work histogram. It features a probability spike at zero work that rises to ~0.2 (not shown). Relaxed cross-bridges are not (or rarely) actin bound and are not discritized. The active–rigor transition work histogram is identical to that in Figure 12.
DISCUSSION
Myosin performs ATP free energy transduction into mechanical work by coordinating ATP hydrolysis at the active site, actin affinity modulation at the actin binding site, and the lever-arm power stroke, via allosteric transduction pathways operating in a time-ordered sequence. The enzyme chemistry summarized in Scheme 1 assigns myosin transient structures to the key events in transduction. Lever-arm swing accompanies the power stroke at the rate-limiting step and upon repriming. Myosin light chains bind to IQ-motifs, a loosely conserved sequence IQX3RGX3–4R where X can be any amino acid,25 on the lever-arm and track with lever-arm movement. Figure 1 indicates the spatial arrangement of RLC and ELC on the lever-arm.
Myosin from which the light chains are removed displays collapsed heads and tends to form head-to-head aggregates.26–28 Removal of one or both light chains causes a proportional reduction in in vitro motility without altering the actin-activated ATPase, indicating both myosin light chains stabilize the lever-arm.29 Skeletal myosin with a reconstituted skeletal RLC carrying a point mutation showed decreased in vitro motility velocity that was traced to a diminished step size compared to wild type.30 FHC-linked RLC mutations R58Q and N47K were individually expressed in HCRLC and substituted for the endogenous RLC in porcine ventricular myosin. The two mutant myosin chimers were characterized with the in vitro motility assay. While they performed normally under unloaded conditions, both chimers showed reductions in force and power output compared with WT although the N47K mutation showed the more severe defect. Defects in both mutants were attributed to a loss in RLC-mediated strain sensitivity of ADP affinity.31 These data show consistent evidence that the light chains support lever-arm stability and rigidity and that specific RLC mutations undermine these features of myosin structure critical for contractility.
Our HCRLC-PAGFP replaces the native RLC in the porcine papillary muscle fiber and restores normal contractility (Figure 6). The substitution situates a photoactivatable fluorescent probe on the lever-arm, enabling the tracking of single lever-arm movement within the condensed medium of the fiber lattice. Significant background light is observed under TIR illumination from the HCRLC-PAGFP exchanged papillary fibers along with the photoactivated chromophore (Figure 7); nevertheless, the spatial emission pattern from single molecules was observed and fitted to estimate emission dipole orientation (Figure 8). Fitting accuracy was improved by using z-stack imagery where the photoactivated single molecules are imaged as a function of the axial position of the objective. By simultaneously fitting emission patterns from the different z-stack images, while correcting for the spherical aberration introduced to the out-of-focus image by the objective, better accuracy is achieved in the emission dipole orientation estimate.
Single emission dipole orientation distributions were constructed that distinguished relaxed, rigor, and active cross-bridges in their polar (β) and azimuthal (α) degrees of freedom relative to the fiber symmetry axis (Table 2 and Figure 9). The 2-D scatter plot of the (β, α) pairs identified a depletion zone at (β, α) ≈ (90°, 90°) (Figure 10). The depleted zone is due to steric/molecular-crowding constraints originating from the thick filament that depopulate orientations unfavorable for actin interaction. The single molecule data provide a unique insight since the steric/crowding constraints causing the depletion zone would not be detected in ensemble-averaged probe orientation data. Furthermore, the steric constraints affect cross-bridge lever-arm orientation in a manner that can not be reproduced in vitro. The GFP tag could introduce a static disordering perturbation to in situ myosin structure, causing the depopulated zone. However, this seems unlikely because the structural perturbation does not affect isometric contraction force and because the depopulated zone seems to have the useful purpose to align myosin heads with their actin binding sites.
The myosin motor protein functions according to Scheme 1 in the crowded environment of the muscle fiber. Crowding presents a thermodynamic energy barrier to protein conformation change that increases protein surface area. We showed previously that crowding induced by large cosolvent polymers in solution favors the compact M** conformation over higher surface area states M, M^, and M*.32 This effect, separate from the steric forces but also affecting the 2-D scatter plot in Figure 10, can be expected to modify lever-arm stability and swing trajectory again, suggesting the in situ fiber environment, where myosin concentration is 120–300 μM,33,34 is essential for evaluating lever-arm conformation in a muscle.
Figure 11A, B indicates the principal angle rotation (Φ) distributions for relax and active self-transitions overlaid on the random self-transition distribution. These analytics give distinct representations to the thick filament steric/crowding constraint and the thin filament actomyosin interaction constraint. Panel A represents the steric/crowding constraints on cross-bridge order with the relax self-transition probability surplus at 70° ≤ Φ < 90°. Panel B includes the impact of the actomyosin interaction constraint that instigates a unique probability surplus in the 0° ≤ Φ < 25° range.
Relaxed cross-bridges represent the M* and M** (mainly M**) pre-power-stroke myosin conformations (Scheme 1). They exert no ensemble-averaged macroscopic force on the fiber lattice. Rigor and active cross-bridges are post-power-stroke (M and conformations distributed between M** and M^, respectively) since both states exert an ensemble-averaged macroscopic force on the fiber lattice. The recombination of relax, rigor, and active dipole data allows us to identify three levels of fiber tension and their impact on Φ. The tension level cases are the low-tension producing relax–rigor transitions, the high-tension producing relax–active transitions, and the intermediate-tension producing rigor–active transitions. Contrasting the latter with the other Φ distributions shows that both thick and thin filament lattice elements destrain with decreasing tension (Figure 11C) and that thin filament lattice elements strain first with increasing tension (Figure 11D). That the thin filament strains first with rising tension suggests that the thin filament is stiffer than the lever-arm (or other extensible thick filament element) under fiber tension. This result is expected, however, the ability to detect thin filament extensibility with the lever-arm probe is unexpected. Fiber tension produces strain on the lattice elements that is quantifiable with our single molecule technique. A static disordering perturbation potentially introduced by the GFP tag could broaden the principal angle distributions indicated in Figure 11 but probably could not introduce a systematic effect that would impact data interpretation.
We have identified three constraints on myosin: the thick filament steric/crowding constraints and the thin filament acto-myosin interaction constraint. They are unique to the in situ fiber system and impact lever-arm orientation observable with single molecule detection. Figure 12 shows a model summarizing our findings with the lever-arm fluorescent probe. Fiber tension, F0, produces strain on the lever-arm quantified by strain angle ξ. The variable strain is detected and interpreted by the Φ distributions in Figure 11. Equation 4 provides a qualitative relationship between cross-bridge work, strain responsiveness, ξ, and the observable parameter, Φ, for active–rigor transitioning. Interpreted in a work histogram (Figure 12), the data indicate a discretized work, suggesting myosin substates in the power stroke. The discretized working stroke is reminiscent of the Huxley–Simmons contraction model35 but in the context of the rotating lever-arm power-stroke.
Lever-arm stability and strain-responsiveness are probably impacted by RLC or ELC mutation. If so, they will manifest as changes, compared to wild type, in single cross-bridge angular transitions that affect work production. Thus, the single molecule detection of tagged myosin lever-arms in the fiber addresses key aspects of in situ motor function for its sensitivity to disease-causing mutation in the light chains when the mutants affect cross-bridge work production.
Acknowledgments
Funding
This work was supported by NIH grants R01AR049277 and R01HL095572 and by the Mayo Foundation.
We thank Andrew Hipp for expressing the HCRLC-PAGFP. We gratefully acknowledge inspiration from Cica Ajtai.
ABBREVIATIONS
- ELC
myosin essential light chain
- EMCCD
electron multiplying charge-coupled device
- FHC
familial hypertrophic cardiomyopathy
- GFP
green fluorescent protein
- HCRLC-PAGFP
human ventricular RLC C-term tagged with PAGFP
- MHC
myosin heavy chain
- MLC
myosin light chain
- PAGFP
photoactivatable GFP
- PMSF
phenylmethylsulfonyl fluoride
- PSF
point spread function
- RLC
myosin regulatory light chain
- S1
myosin subfragment 1
- SDS/PAGE
sodium dodecyl sulfate/polyacrylamide gel electrophoresis
- S/N
signal-to-noise
- TIR(F)
total internal reflection (fluorescence)
References
- 1.Ohki T, Mikhailenko SV, Morales MF, Onishi H, Mochizuki N. Transmission of force and displacement within the myosin molecule. Biochemistry. 2004;43:13707–13714. doi: 10.1021/bi048954f. [DOI] [PubMed] [Google Scholar]
- 2.Rayment I, Rypniewski WR, Schmidt-Base K, Smith R, Tomchick DR, Benning MM, Winkelmann DA, Wesenberg G, Holden HM. Three-dimensional structure of myosin subfragment-1: A molecular motor. Science. 1993;261:50–58. doi: 10.1126/science.8316857. [DOI] [PubMed] [Google Scholar]
- 3.Ajtai K, Halstead MF, Nyitrai M, Penheiter AR, Zheng Y, Burghardt TP. The Myosin C-Loop Is an Allosteric Actin Contact Sensor in Actomyosin. Biochemistry. 2009;48:5263–5275. doi: 10.1021/bi900584q. [DOI] [PMC free article] [PubMed] [Google Scholar]
- 4.Patterson GH, Lippincott-Schwartz J. A photoactivatable GFP for selective photolabeling of proteins and cells. Science. 2002;297:1873–1877. doi: 10.1126/science.1074952. [DOI] [PubMed] [Google Scholar]
- 5.Burghardt TP, Ajtai K. Single-molecule fluorescence characterization in native environment. Biophys Rev. 2010;2:159–167. doi: 10.1007/s12551-010-0038-z. [DOI] [PMC free article] [PubMed] [Google Scholar]
- 6.Böhmer M, Enderlein J. Orientation imaging of single molecules by wide-field epifluorescence microscopy. J Opt Soc Am B. 2003;20:554–559. [Google Scholar]
- 7.Burghardt TP. Single Molecule Fluorescence Image Patterns Linked to Dipole Orientation and Axial Position: Application to Myosin Cross-Bridges in Muscle Fibers. PLoS One. 2011;6:e16772. doi: 10.1371/journal.pone.0016772. [DOI] [PMC free article] [PubMed] [Google Scholar]
- 8.Szczesna-Cordary D, Guzman G, Zhao JJ, Hernandez O, Wei JQ, Diaz-Perez Z. The E22K mutation of myosin RLC that causes familial hypertrophic cardiomyopathy increases calcium sensitivity of force and ATPase in transgenic mice. J Cell Sci. 2005;118:3675–3683. doi: 10.1242/jcs.02492. [DOI] [PubMed] [Google Scholar]
- 9.Szczesna-Cordary D, Jones M, Moore JR, Watt J, Glenn W, Kerrick L, Xu Y, Wang Y, Wagg C, Lopaschuk GD. Myosin regulatory light chain E22K mutation results in decreased cardiac intracellular calcium and force transients. FASEB J. 2007;21:3974–3985. doi: 10.1096/fj.07-8630com. [DOI] [PubMed] [Google Scholar]
- 10.Greenberg MJ, Watt JD, Jones M, Kazmierczak K, Szczesna-Cordary D, Moore JR. Regulatory light chain mutations associated with cardiomyopathy affect myosin mechanics and kinetics. J Mol Cell Cardiol. 2009;46:108–115. doi: 10.1016/j.yjmcc.2008.09.126. [DOI] [PMC free article] [PubMed] [Google Scholar]
- 11.Burghardt TP, Ajtai K, Chan DK, Halstead MF, Li J, Zheng Y. GFP Tagged Regulatory Light Chain Monitors Single Myosin Lever-Arm Orientation in a Muscle Fiber. Biophys J. 2007;93:2226–2239. doi: 10.1529/biophysj.107.107433. [DOI] [PMC free article] [PubMed] [Google Scholar]
- 12.Burghardt TP, Li J, Ajtai K. Single Myosin Lever-Arm Orientation in a Muscle Fiber Detected with Photo-activatable GFP. Biochemistry. 2009;48:754–765. doi: 10.1021/bi8017703. [DOI] [PMC free article] [PubMed] [Google Scholar]
- 13.Szczesna-Cordary D, Guzman G, Ng S-S, Zhao J. Familial hypertrophic cardiomyopathy-linked alterations in Ca2+ binding of human cardiac myosin regulatory light chain affect cardiac muscle contraction. J Biol Chem. 2004;279:3535–3542. doi: 10.1074/jbc.M307092200. [DOI] [PubMed] [Google Scholar]
- 14.Dweck D, Reyes-Alfonso A, Potter JD. Expanding the range of free calcium regulation in biological solutions. Anal Biochem. 2005;347:303–315. doi: 10.1016/j.ab.2005.09.025. [DOI] [PubMed] [Google Scholar]
- 15.Kron SJ, Toyoshima YY, Uyeda TQP, Spudich JA. Assays for actin sliding movement over myosin-coated surfaces. Methods Enzymol. 1991;196:399–416. doi: 10.1016/0076-6879(91)96035-p. [DOI] [PubMed] [Google Scholar]
- 16.Burghardt TP, Thompson NL. Evanescent intensity of a focused gaussian light beam undergoing total internal reflection in a prism. Opt Eng. 1984;23:62–67. [Google Scholar]
- 17.Bobroff N. Position measurement with a resolution and noise-limited instrument. Rev Sci Instrum. 1986;57:1152–1157. [Google Scholar]
- 18.Thompson RE, Larson DR, Webb WW. Precise nanometer localization analysis for individual fluorescent probes. Biophys J. 2002;82:2775–2783. doi: 10.1016/S0006-3495(02)75618-X. [DOI] [PMC free article] [PubMed] [Google Scholar]
- 19.Betzig E, Chichester RJ. Single molecules observed by near-field scanning optical microscopy. Science. 1993;262:1422–1425. doi: 10.1126/science.262.5138.1422. [DOI] [PubMed] [Google Scholar]
- 20.Mattheyses A, Axelrod D. Fluorescence emission patterns near glass and metal-coated surfaces investigated with back focal plane imaging. J Biomed Opt. 2005;10:054007. doi: 10.1117/1.2052867. [DOI] [PubMed] [Google Scholar]
- 21.Bartko AP, Dickson RM. Three-Dimensional Orientations of Polymer-Bound Single Molecules. J Phys Chem B. 1999;103:3053–3056. [Google Scholar]
- 22.Mortensen KI, Churchman LS, Spudich JA, Flyvbjerg H. Optimized localization analysis for single-molecule tracking and super-resolution microscopy. Nature Methods. 2010;7:377–381. doi: 10.1038/nmeth.1447. [DOI] [PMC free article] [PubMed] [Google Scholar]
- 23.Uyeda TQP, Abramson PD, Spudich JA. The neck region of the myosin motor domain acts as a lever arm to generate movement. Proc Natl Acad Sci USA. 1996;93:4459–4464. doi: 10.1073/pnas.93.9.4459. [DOI] [PMC free article] [PubMed] [Google Scholar]
- 24.Molloy JE, Burns JE, Kendrick-Jones J, Tregear RT, White DCS. Movement and force produced by a single myosin head. Nature. 1995;378:209–212. doi: 10.1038/378209a0. [DOI] [PubMed] [Google Scholar]
- 25.Cheney RE, Mooseker MS. Unconventional myosins. Curr Opin Cell Biol. 1992;4:44–48. doi: 10.1016/0955-0674(92)90055-h. [DOI] [PubMed] [Google Scholar]
- 26.Flicker PF, Wallimann T, Chatman T. Electron microscopy of scallop myosin: Location of regulatory light chains. J Mol Biol. 1983;169:723–741. doi: 10.1016/s0022-2836(83)80167-3. [DOI] [PubMed] [Google Scholar]
- 27.Trybus KM, Waller GS, Chatman TA. Coupling of ATPase activity and motility in smooth muscle myosin is mediated by the regulatory light chain. J Cell Biol. 1994;124:963–969. doi: 10.1083/jcb.124.6.963. [DOI] [PMC free article] [PubMed] [Google Scholar]
- 28.Chen P, Ostrow BD, Tafuri SR, Chisholm RL. Targeted disruption of the Dictyostelium RMLC gene produces cells defective in cytokinesis and development. J Cell Biol. 1994;127:1933–1944. doi: 10.1083/jcb.127.6.1933. [DOI] [PMC free article] [PubMed] [Google Scholar]
- 29.Lowey S, Waller GS, Trybus KM. Skeletal muscle myosin light chains are essential for physiological speeds of shortening. Nature. 1993;365:454–456. doi: 10.1038/365454a0. [DOI] [PubMed] [Google Scholar]
- 30.Sherwood JJ, Waller GS, Warshaw DM, Lowey S. A point mutation in the regulatory light chain reduces the step size of skeletal muscle myosin. Proc Natl Acad Sci USA. 2004;101:10973–10978. doi: 10.1073/pnas.0401699101. [DOI] [PMC free article] [PubMed] [Google Scholar]
- 31.Greenberg MJ, Kazimierczak K, Szczesna-Cordary D, Moore JR. Cardiomyopathy-linked myosin regulatory light chain mutations disrupt myosin strain-dependent biochemistry. Proc Natl Acad Sci USA. 2010;107:17403–17408. doi: 10.1073/pnas.1009619107. [DOI] [PMC free article] [PubMed] [Google Scholar]
- 32.Peyser YM, Shaya S, Ajtai K, Burghardt TP, Muhlrad A. Cosolvent induced aggregation inhibits myosin ATPase activity by stabilizing the predominant transition intermediate. Biochemistry. 2003;42:12669–12675. doi: 10.1021/bi0350093. [DOI] [PubMed] [Google Scholar]
- 33.Bagshaw CR. Outline Studies of Biology: Muscle Contraction. Chapman and Hall; London: 1982. p. 22. [Google Scholar]
- 34.Tikunov BA, Sweeney HL, Rome LC. Quantitative electrophoretic analysis of myosin heavy chains in single muscle fibers. J Appl Physiol. 2001;90:1927–1935. doi: 10.1152/jappl.2001.90.5.1927. [DOI] [PubMed] [Google Scholar]
- 35.Huxley AF, Simmons RM. Proposed mechanism of force generation in striated muscle. Nature. 1971;233:533–538. doi: 10.1038/233533a0. [DOI] [PubMed] [Google Scholar]


