Fig. 4.
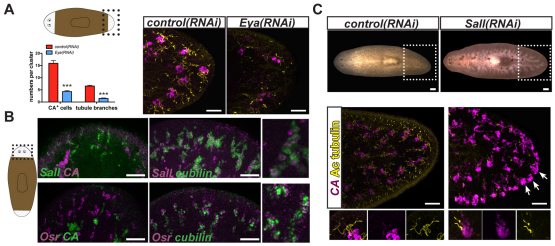
Eya and Sall are required for protonephridia regeneration and Osr is expressed in tubule cells. (A) Eya(RNAi) animals failed to regenerate protonephridia. Cartoon depicts region analyzed. Left: numbers of tubule branches (Ac tubulin+) and tubule-associated cells (CA+) per cluster in control and Eya RNAi animals six days following amputation, 15 days following RNAi initiation. Data are mean ± s.e.m. (>12 animals per group). ***P<0.0001 determined by Student's t-test. Right: fluorescence in situ hybridization and immunolabeling of a regenerating control or Eya RNAi animal (tail blastema shown; anterior, left) using the CA (magenta) RNA probe and an anti-acetylated tubulin antibody (yellow). Scale bars: 0.05 mm. (B) Sall and Osr are expressed in tubule cells. Cartoon depicts blastema region imaged. Anterior, up. Scale bars: 0.05 mm. Insets on right show colocalization of transcription regulatory gene RNA (magenta) and cubilin (green). (C) Top: Sall(RNAi) animals bloated during tissue turnover in intact animals (17/20 animals bloated between days 43 and 46 after initial RNAi). Dotted box indicates the area depicted below. Middle: A bloated Sall(RNAi) animal with reduced tubule (Ac tubulin+, yellow) and increased tubule-associated cell numbers (CA+, magenta) is shown. Arrows indicate example clusters of ectopic tubule-associated cells at the animal periphery. Bottom: Higher magnification images of control and Sall(RNAi) clusters. Anterior, left. Scale bars: 0.05 mm.

