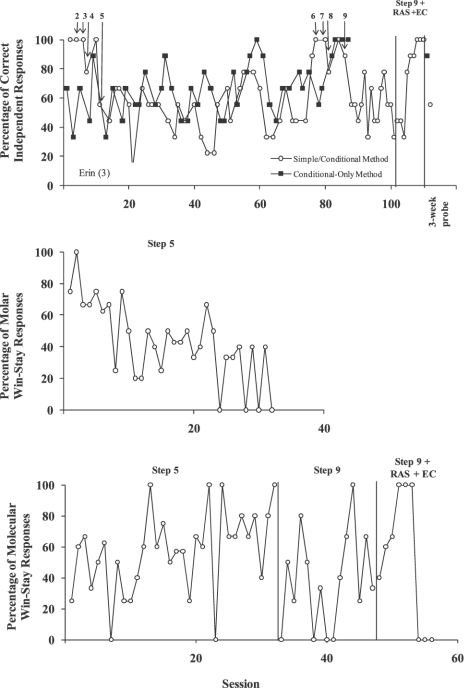
Figure 4.
Percentage of correct independent responses (top), percentage of molar win-stay responses (middle), and percentage of molecular win-stay responses (bottom) during Erin's third evaluation. RAS = repeated auditory stimulus; EC = error correction. The numbered arrows represent steps in the simple-conditional method.

