
Figure 4.
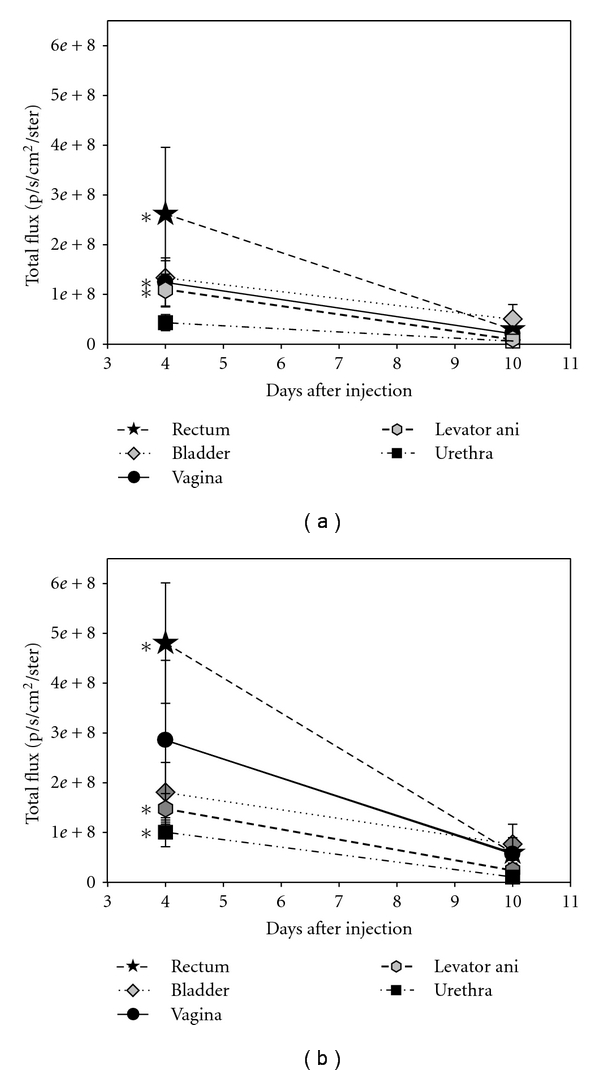
Total fluorescent flux 4 and 10 days after (a) sham vaginal distension and (b) vaginal distension (VD). Values are displayed as mean ± standard error of 5-6 animals/group. ∗ denotes a statistically significant difference compared to the same organs 10 days after sham VD or VD (P < 0.05).