Figure 1.

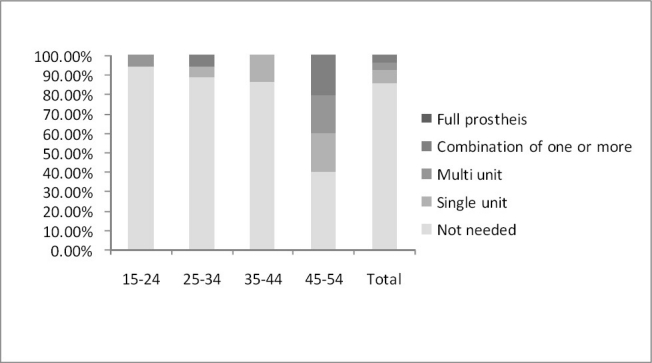
Prosthetic needs in the upper arch of the study population in relation to age groups. (Chi square = 133.91, d.f. = 9, P <0.001)

Prosthetic needs in the upper arch of the study population in relation to age groups. (Chi square = 133.91, d.f. = 9, P <0.001)