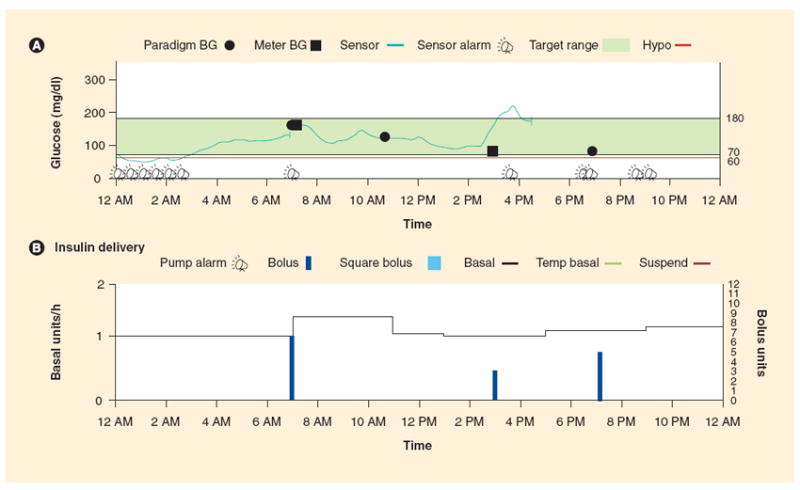
Figure 4. Sensor-augmented pump daily summary graph.

(A) A typical daily sensor-augmented pump graph report of sensor glucose values with meter glucose values recorded for calibration and as confirmatory fingerstick testing (squares). The green shaded area represents the target glucose range, and multiple low glucose alarms are noted between 12 and 3 AM with no response from the user of the continuous glucose monitoring device. (B) Basal and bolus insulin delivered during a 24 h period, including insulin delivery status at the time of hypoglycemic episodes.
BG: Blood glucose.
