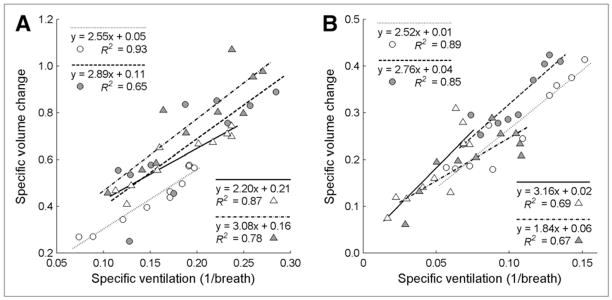
FIGURE 2.
Relationship between sV̇B and sVol in 10 ventrodorsal ROIs for each sheep at baseline (empty symbols) and after ventilation (filled symbols). Note different axis scales for experiments with ZEEP (A) and experiments with PEEP (B), with each sheep in these groups represented by different symbol. R2 ranged from 0.65 to 0.93, with average of 0.79 ± 0.11. For ZEEP experiments, sV̇B and sVol values, ranges, and y-intercepts tended to be higher than for PEEP experiments.

