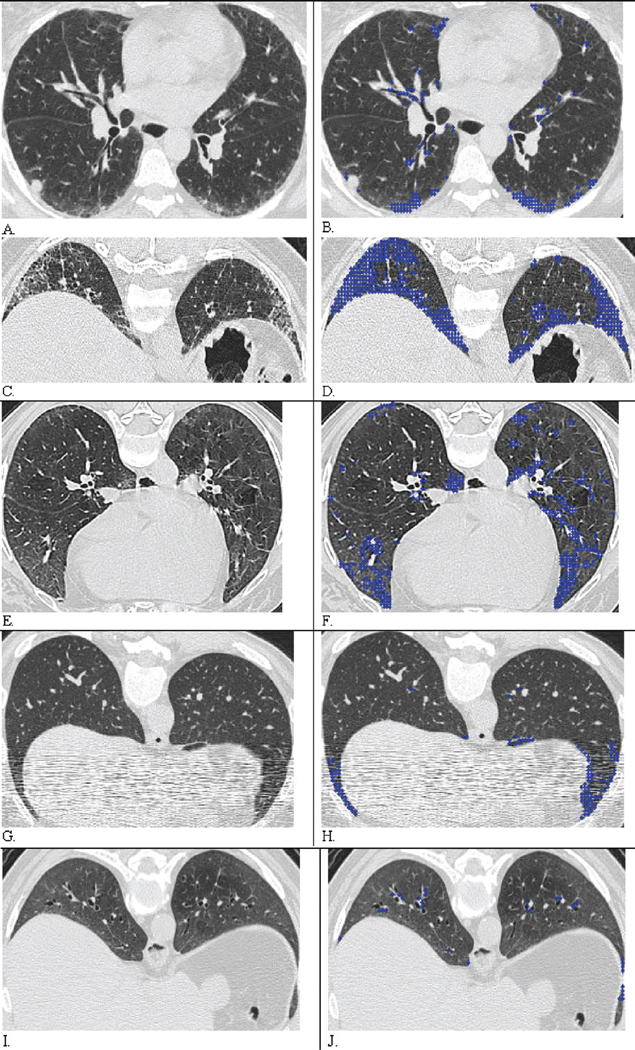
Fig. 5.
Result of Automated Classification of Quantitative Fibrosis (QLF) and scores: A, C, E, G, and I were original CT images and are coupled with their overlaid images B, D, F, H, and J, respectively. Blue dots indicate classified Pulmonary Fibrosis (PF). A. Both radiologist scored as 1 = (1, 25%) in both zones. B. CAD Quantitative lung fibrosis (QLF) score were 4% and 5% of in both zones and agreed with visual semi-QLF score at 1% thresholds. C. Both radiologists scored as 2 = (26, 50%) in both zones. D. QLF score were 30% and 29% in the right and left zones. E. Both radiologists scored as 0 in right and left zones. F. QLF detected and scores were 4.4% and 6.0% of in the right and left middle zones, where bilateral peripheral fibrosis is detected in dependent lung. G. When CT images were degraded by streak artifact, two radiologists scored as 0 in both zones. H. De-noised CAD-based QLF score improved detection of PF as 5% and 6% of in the right and left lower zones. I. Both radiologists scored as 2= (26, 50%) in both zones. J. QLF score underscored PF as 5% and 4% of in both zones compared with both radiologists’ scores. CAD classified the abnormal region as GGO when both radiologists might have scored the abnormality as PF.

