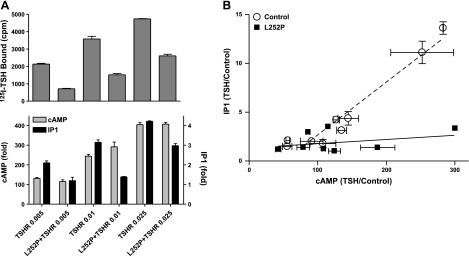
Figure 5.
Effects of TSH to stimulate cAMP and IP1 production in cells expressing TSHRs alone compared to cells expressing TSHRs and L252Ps. A) Cells were transfected with TSHR alone (0.005, 0.01, or 0.025 μg TSHR plasmid+0.5 μg empty plasmid) or with L252P (0.5 μg plasmid) + TSHR (0.005, 0.01, or 0.025 μg TSHR plasmid). After 48 or 72 h, 125I-TSH binding (top panel) and stimulation of cAMP and IP1 production by 100 mU/ml TSH (bottom panel) were measured as described in Materials and Methods. Results shown are from 1 of 4 experiments performed in duplicate. Bars represent means ± range. B) Comparison of the effects of TSH to stimulate IP1 and cAMP production. Stimulation of cAMP and IP1 production by 100 mU/ml TSH were measured as described in Materials and Methods. Results are presented as fold stimulation over control (TSH/control) from 4 experiments performed in duplicate. Points represent means ± se. Lines represent linear regression analyses of data from cells expressing TSHRs alone (TSHR/TSHR, dotted line) and cells expressing L252Ps and TSHRs (TSHR/L252P, solid line). Slope of the line for TSHR/TSHR is 0.054 ± 0.0036 and for TSHR/L252P is 0.0043 ± 0.0041 (means±sd).

