Figure 3.

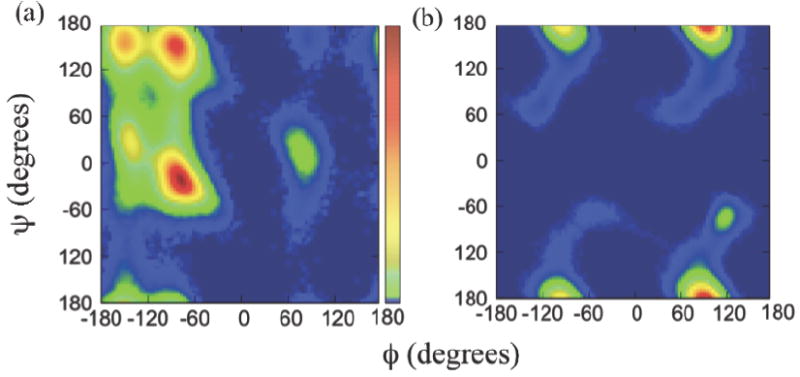
The (ϕ, ψ) Ramachandran plots of (a) polyalanine and (b) sarcosine 50mers, obtained from the replica exchange MD simulations. The scale bar in (a) represents from no population in blue color to the highest population in red.

The (ϕ, ψ) Ramachandran plots of (a) polyalanine and (b) sarcosine 50mers, obtained from the replica exchange MD simulations. The scale bar in (a) represents from no population in blue color to the highest population in red.