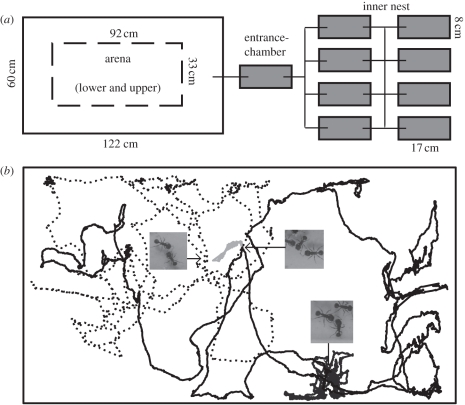
Figure 1.
(a) Laboratory nest structure, grey shading denotes dark chambers. (b) Walking trajectories of four ants in the entrance chamber. The photos and arrows show interactions among these four ants that were identified using the trajectory data. The turning index (standard deviation of turning angle) for the paths shown are light grey, 131°; dark grey, 122°; solid black, 101°; dotted black, 92°.

