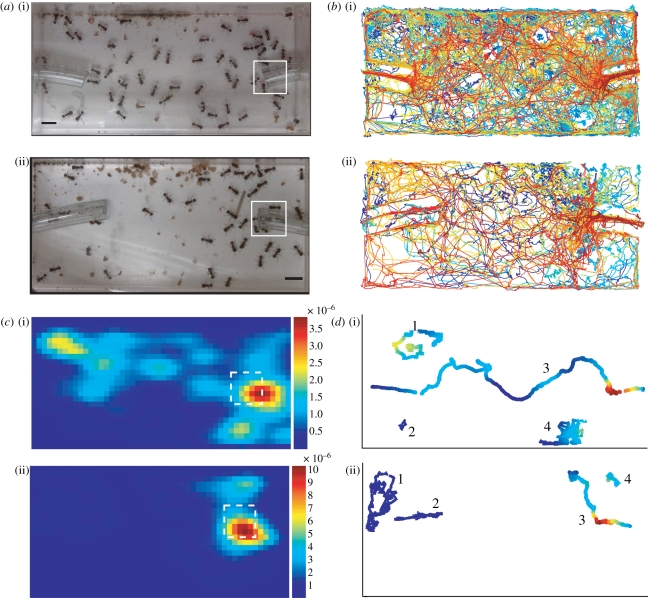
Figure 2.
Spatial analysis of the entrance chamber for the two study colonies ((i) Beth; (ii) Gozde). (a) Images of the entrance chamber. Left tube leads to the foraging arena, right tube leads to the inner nest. White squares are the ROI around the entrance leading to the inner nest. (b) All ant trajectories. Each ant is represented in a different colour. (c) The utilization distribution map of ant interactions. Colour represents the interaction density estimate at each location. The dashed squares are in the same location as the solid squares in (a). (d) Trajectories of four ants illustrating the interpolation of the interaction density onto the ant trajectories. Trajectory colour represents the interaction density in each location and is on the same colour-scale as in (c). Numbers are used to distinguish the four ant trajectories.

