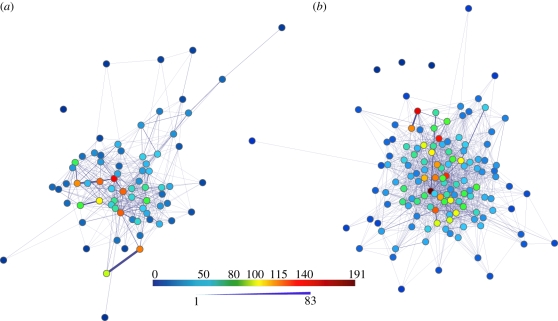
Figure 3.
Interaction network among ants in the entrance chamber of two laboratory housed colonies ((a) Gozde; (b) Beth). Each ant is represented as a node in the network. Node colours reflect the WD of an ant (same colour scale for both colonies). Edge thickness corresponds to the number of interactions. Network layout is ‘Spring embedded’ in which the distance between nodes corresponds to how tightly they are connected. Networks were created using Cytoscape 2.6.2.

