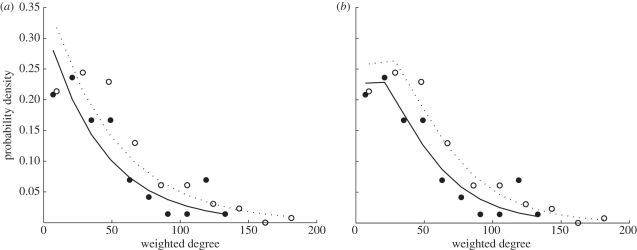
Figure 4.
WD distribution of the interaction network in the entrance chamber of two laboratory housed colonies. Open circles (Beth) and closed circles (Gozde) represent binned weighted degree for each colony. The dotted (Beth) and solid (Gozde) lines are the fits of (a) a geometric distribution to the data; (b) a negative binomial distribution to the data. (See figure S6 in the electronic supplementary material for a representation of this figure on a log-linear scale).

