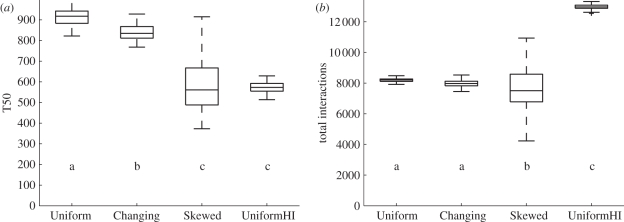
Figure 6.
(a) Boxplot of the T50, averaged for the 100 simulations for each of the four models. Models with different lower case letters are significantly different (Tukey's test p < 0.0001). (b) Boxplot of the total number of interactions, averaged for the 100 simulations of each of the four models. Models with different lower case letters are significantly different (Tukey's test p < 0.05).

