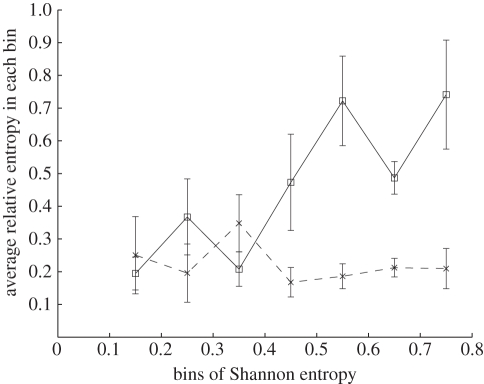
Figure 2.
Mean and standard error of relative entropy Si +1,j in each bin of Shannon entropy. Shannon entropy and relative entropy in each of the 329 positions and in each of the 17 seasons between 1992–1993 (i = 0) and 2008–2009 (i = 16) fall into one of the eight bins. The first bin with Shannon entropy less than 0.1 is discarded. Bins with larger Shannon entropy Di,j also have larger relative entropy Si +1,j . Shannon entropy Di,j and relative entropy Si +1,j in iteration i = 51–100 of the neutral evolution model (crosses) are used to calculate mean and standard error of relative entropy in each bin of Shannon entropy distribution in the same way. No increasing trend is found. Error bar is one standard error. Open squares represent H3 data.

