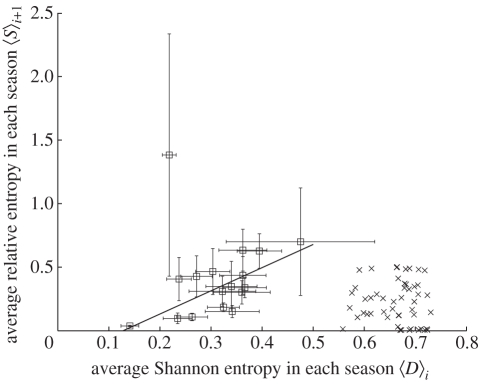
Figure 3.
Average Shannon entropy 〈D〉i versus average relative entropy 〈S〉i +1 for each season between 1992–1993 (i = 0) and 2008–2009 (i = 16). For each season i, a set of amino acid positions j with Shannon entropy Di,j greater than 0.1 are chosen. For all the j in this set of positions, 〈D〉i is the average of the Shannon entropy Di,j values and 〈S〉i +1 is the average of relative entropy Si +1,j values. Horizontal and vertical error bars are the standard errors of Shannon entropy and relative entropy, respectively. The solid line, 〈S〉i +1 = 1.82〈D〉i−0.23, is a least squares fit of 〈D〉i to 〈S〉i +1 (i = 0,2, …,16). A strong correlation with R2 = 0.50 exists between 〈D〉i and 〈S〉i +1 excluding the point (0.22,1.38) with Ni = 1, which has a large standard error of the relative entropy Si +1,j. Using the same method, 〈D〉i and 〈S〉i +1 are calculated from a neutral evolution model, i = 51–100, and plotted. No visible correlation exists between 〈D〉i and 〈S〉i +1 from the neutral evolution model (crosses). Open squares represent H3 data.

