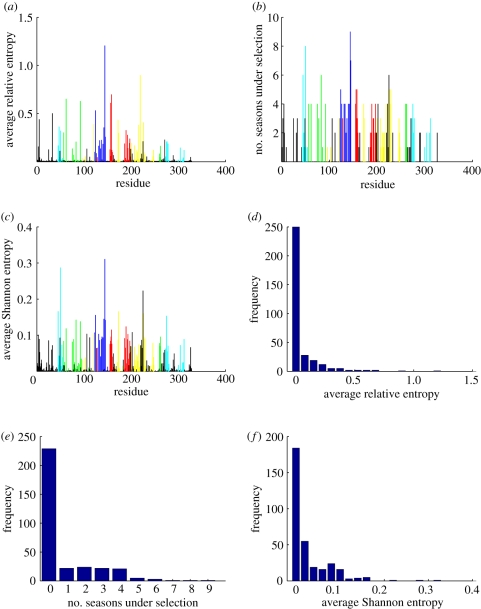
Figure 4.
(a) Average selection in each position quantified by relative entropy during the past 17 seasons from 1993–1994 to 2009–2010, calculated by  . The colours represent positions in epitopes A to E and positions outside the epitopes, as in figure 1. (b) Number of seasons for each position when the relative entropy was greater than the threshold Sithres, i.e. the position was under selection. (c) Average diversity in each position quantified by Shannon entropy in the seasons from 1993–1994 to 2009–2010, calculated by
  . (d) Distribution of the average selection in each position displayed in (a). (e) Distribution of the numbers of seasons under selection displayed in (b). (f) Distribution of the average diversity in each position shown in (c).

