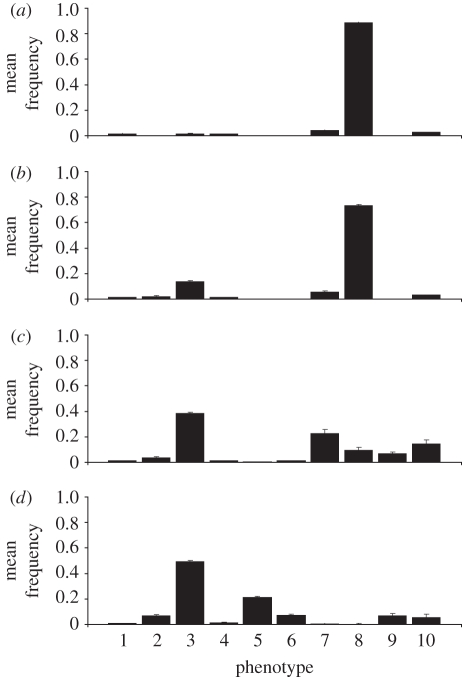
Figure 6.
Mean phenotype frequency for different probabilities ((a) θ = 0.2; (b) θ = 0.3; (c) θ = 0.5; (d) θ = 0.7) of social learning error. Means are calculated for generations 1501–3000 across 10 repeats of each simulation. Population size n = 300, generation lifespan J = 70 steps, number of generations G = 3000, memory factor α = 0.5, probability of erroneous joining β = 0. Phenotypes 1–10 are as described in table 2 (successful phenotypes here: phenotype 8, part-time scrounger that applies exclusively social learning and a complex learning rule; phenotype 3, pure producer that uses a complex learning rule).

