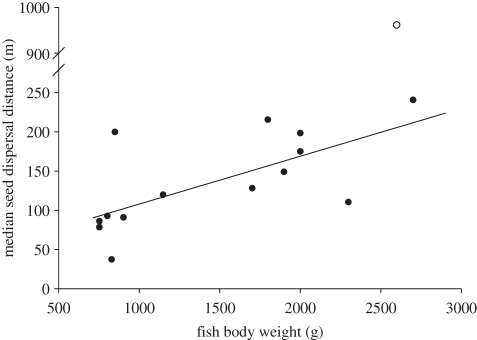
Figure 2.
Median seed dispersal distances increased as a function of fish body weight. Note the break in the y-axis to accommodate the outlier (fish number 994; open circle). The predicted relationship displayed is based on the slope of the regression without the possible outlier (slope: 0.06 ± 0.02 m g–1, F1,12 = 9.87, p = 0.0085, R2 = 45.1%).

