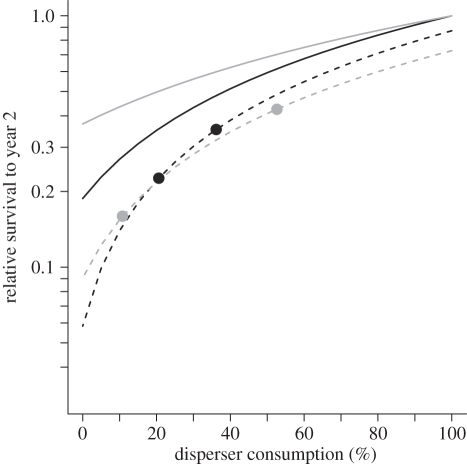
Figure 5.
Sensitivity to and impacts of frugivore loss (alone and in interaction with introduced mammalian seed predators) on survival to year 2 in B. tarairi and C. laevigatus. The solid lines represent the sensitivity (fitted mean seed fate as a function of fruit crop consumed by frugivores) in the absence of mammalian predators (‘cage’), while dotted lines are sensitivity including interactions with mammalian predators (‘open’). The x-axis is per cent of fruit crop consumed by frugivores, but 13% of consumed seeds are assumed dropped under parents (§2). The circles represent the impact based on current field estimates of consumption rates and with mammals present. Survival is relative to best-case condition as in figure 3 (all seeds dispersed, no mammals). Effects on seedling height (table 1) are additional. Black solid line, B. tarairi cage; grey solid line, C. laevigatus cage; black dashed line, B. tarairi open; grey dashed line, C. laevigatus open.

