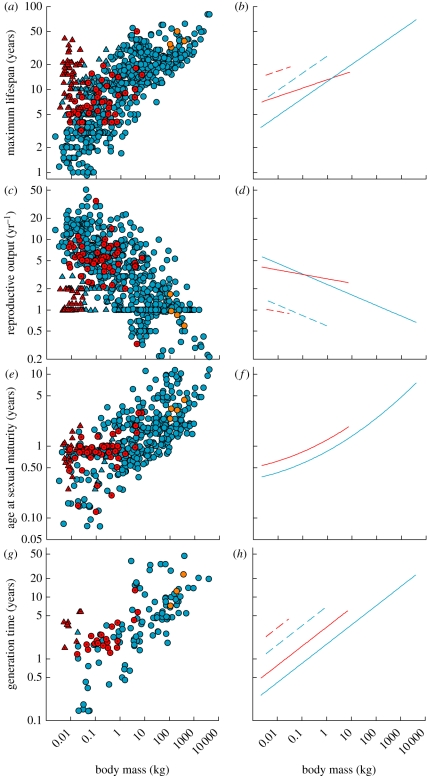
Figure 2.
(a,b) Maximum life span, (c,d) annual reproductive output, (e,f) age at sexual maturity and (g,h) generation time of mammal species as a function of their body mass. Hibernation affected the relationship of each life-history attribute with body mass (see table 2 for regression results). Shown are the raw data and the PGLS model-predicted regression lines. Filled blue circles solid lines, non-hibernators; filled blue triangles dashed lines, non-hibernators (bats); filled red circles solid lines, hibernators; filled red triangles dashed lines, hibernators (bats); filled orange circles, bears.

