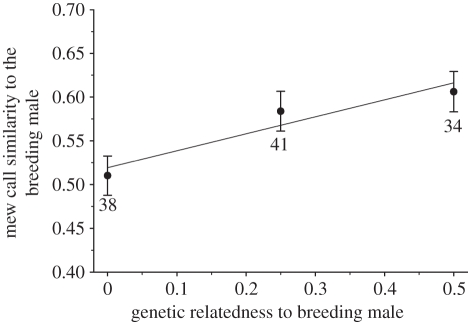
Figure 2.
SPCC coefficients between the mew call exemplars of male helpers and the breeding males provisioning at the same nests relative to their difference in average genetic relatedness. The solid line represents best-fit (see table 1 for estimates), with means ± 1 s.e. presented for each relatedness category. Numbers indicate sample sizes.

