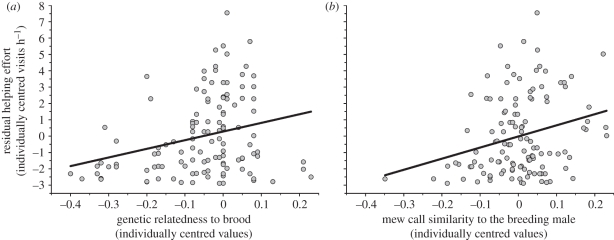
Figure 3.
Within-individual variation in helping effort (residual nest visit rates, controlling for individual identity and sex) explained by within-individual variation in: (a) genetic relatedness to the brood (best-fit line shown: y = 5.42x + 0.29); and (b) mew call similarity to the breeding male (best-fit line shown: y = 6.80x − 0.02). Both relationships are significant, however AICc values indicate that (b) provides the best fit (see table 3 for details).

