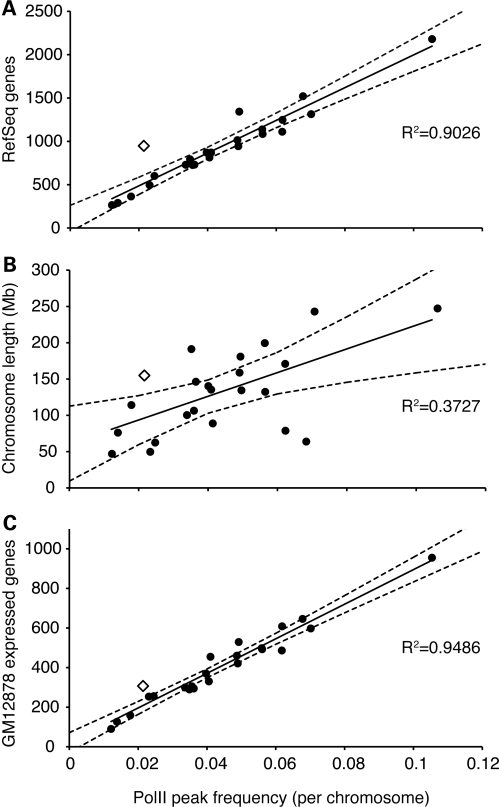
Figure 1.
PolII peaks per chromosome. Each human chromosome is represented by a circle (autosomes) or an open diamond (X chromosome). Linear regression (solid line) and 97% confidence interval (dashed lines) are shown. Number of PolII peaks is shown relative to (A) RefSeq genes; (B) chromosome length; and (C) expressed genes in GM12878 (expression data from Reddy TE, Gertz J, Pauli F, Newberry K, Kucera KS, Wold B, Willard HF, Myers RM, manuscript in preparation).

