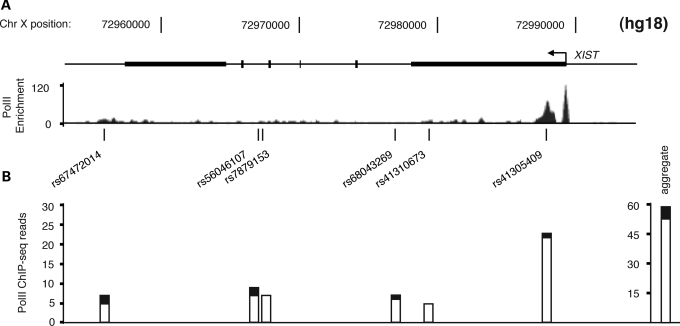
Figure 3.
Xi bias of PolII enrichment at the XIST gene. (A) PolII ChIP-seq enrichment throughout the gene is shown with the highest enrichment near the TSS. Locations and rs numbers of heterozygous SNPs in GM12878 are indicated. (B) Relative PolII occupancy on the two X chromosomes in GM12878, as measured by the number of aligned ChIP-seq reads at each heterozygous SNP, mapping to the Xp (white bars) or Xm (black bars). The aggregated signal from the XIST locus is shown on the far right, indicating significant PolII binding bias toward Xp, consistent with the reported (28) and measured (see Materials and Methods) X-inactivation bias in this cell line.

