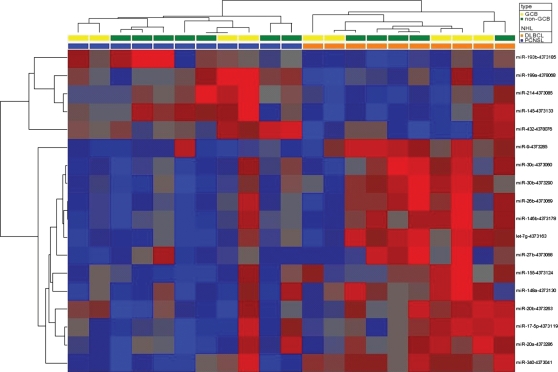
Fig. 3.
Supervised cluster analysis of miRNA levels in PCNSL and nDLBCL. Heatmap of differentially expressed miRNAs. Data normalized to RNU44 (dCt) were hierarchically clustered (Pearson correlation, complete linkage). Red indicates a decrease relative to all data in this set; blue indicates an increase relative to all data in this set.

