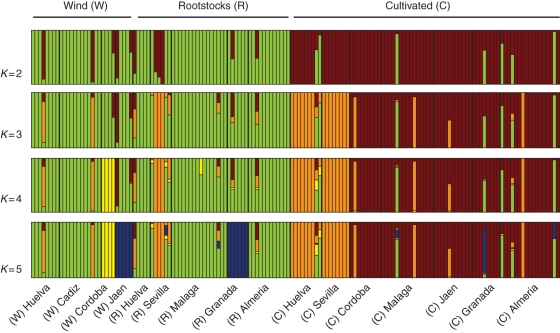
Fig. 3.
Inference of population structure among ancient olive genotypes grouped according to geographical origin, assuming K = 2 to K = 5 subpopulations. Each strain is represented by a single vertical bar that is partitioned into K coloured segments that represent the strain's estimated ancestry proportion in each of the K clusters.

