Fig. 5.
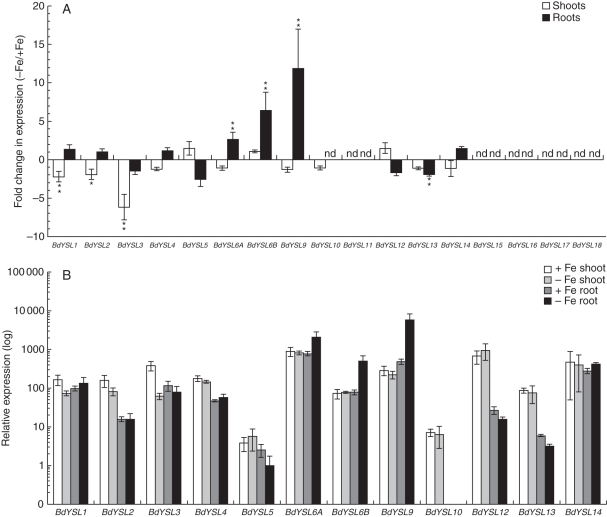
Real-time PCR quantification of BdYSL mRNA levels in Fe-deficient shoots and roots. One-week-old plants were transferred for 10 d to Fe-deficient medium or, as a control, to Fe-containing medium, before harvesting. BdYS1 values were normalized using BdGAPDH and BdUBC18 as internal standards. Two representations of the data are shown. (A) Fold change in mRNA level during iron deficiency. Note the linear scale. (B) Relative expression levels. The condition with the lowest expression level (BdYSL5 Fe-deficient roots) was set to 1, and all other values are set relative to this. Note the log10 scale. Data are means ± s.d. (n = 3). * Minimum 2-fold difference and P < 0·05; **minimum 2-fold differenceand P < 0·01.

